USimComposer Introduction
This introduction to the USimComposer Graphical User Interface demonstrates setting up, running, and visualizing simulations. The rest of USim Quick Start assumes that you have reviewed this section to familiarize yourself with the USimComposer GUI.
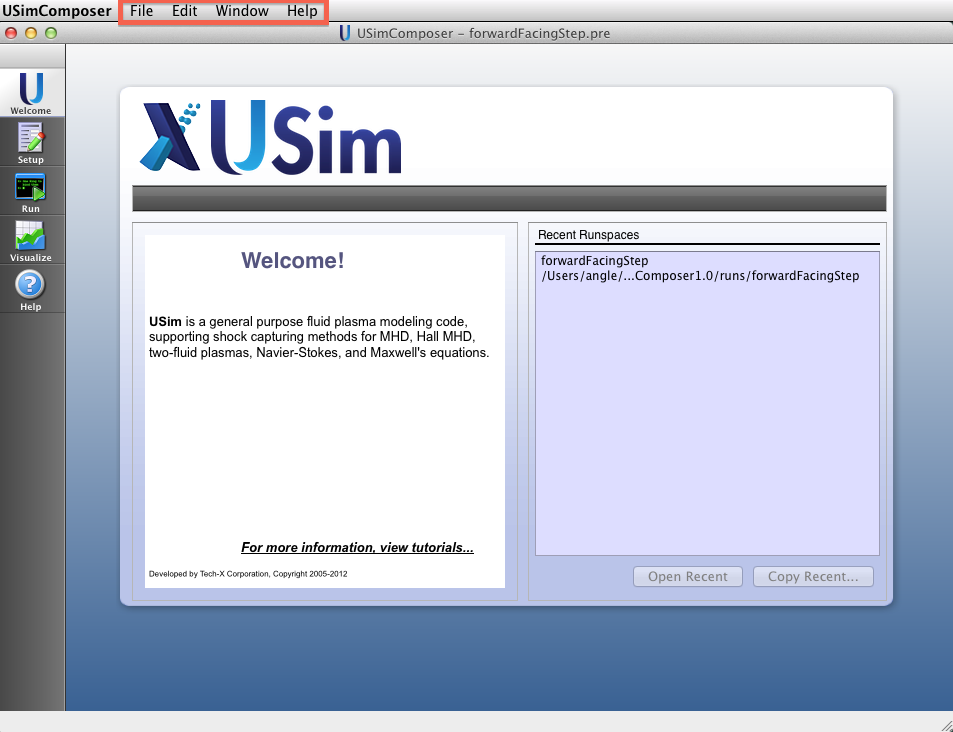
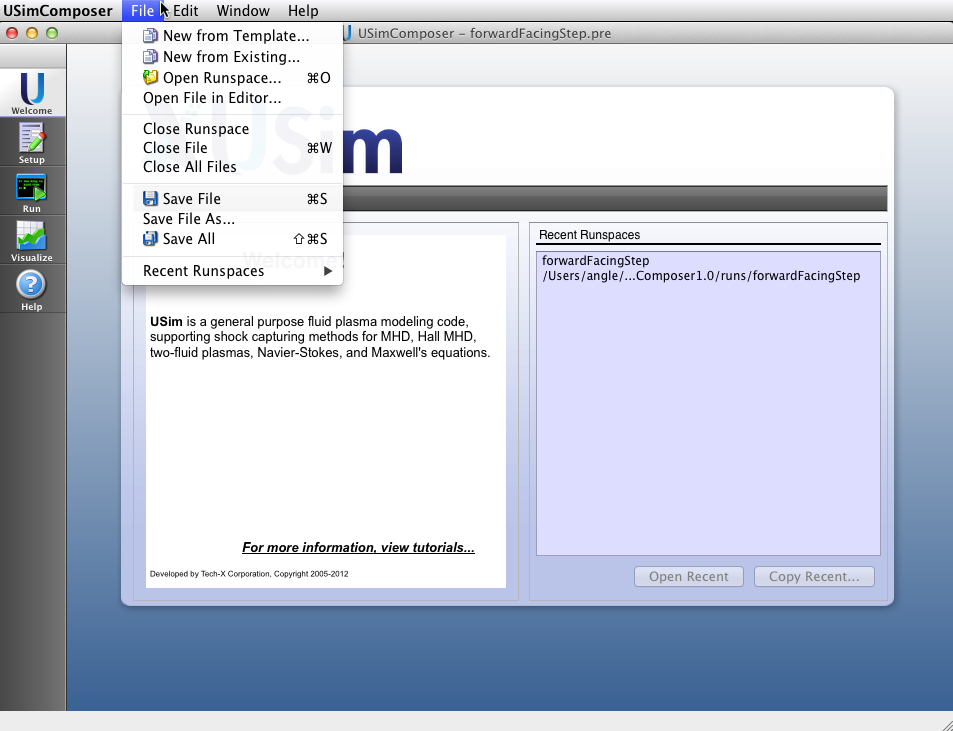
The first sub-section provides an explanation of the basic workflow through the application - consisting of the three steps Setup, Run, and Visualize. Following this portion of the document is a detailed explanation of the options and commands available through the menu bar at the top of the USimComposer window. Finally, this section includes explanations of the default USim settings supplied by USimComposer.
In the HTML version of this document, click on any illustration to see a full size view. The images presented in this section have been captured on a computer running Mac OS X; the USimComposer interface will appear slightly different on Windows and Linux platforms.
Setup Window showing main USimComposer parts. illustrates the layout of the USimComposer GUI using labels for the parts of the interface to which this introduction and the tutorials refer.
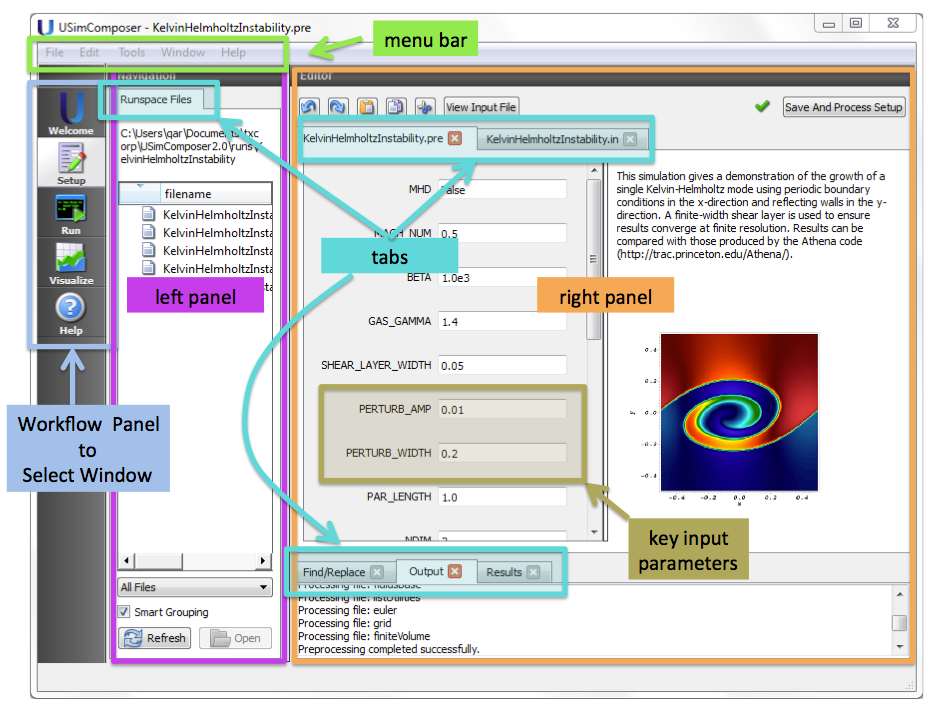
Figure 23: Setup Window showing main USimComposer parts.
Setup
Create New Runspace From Example
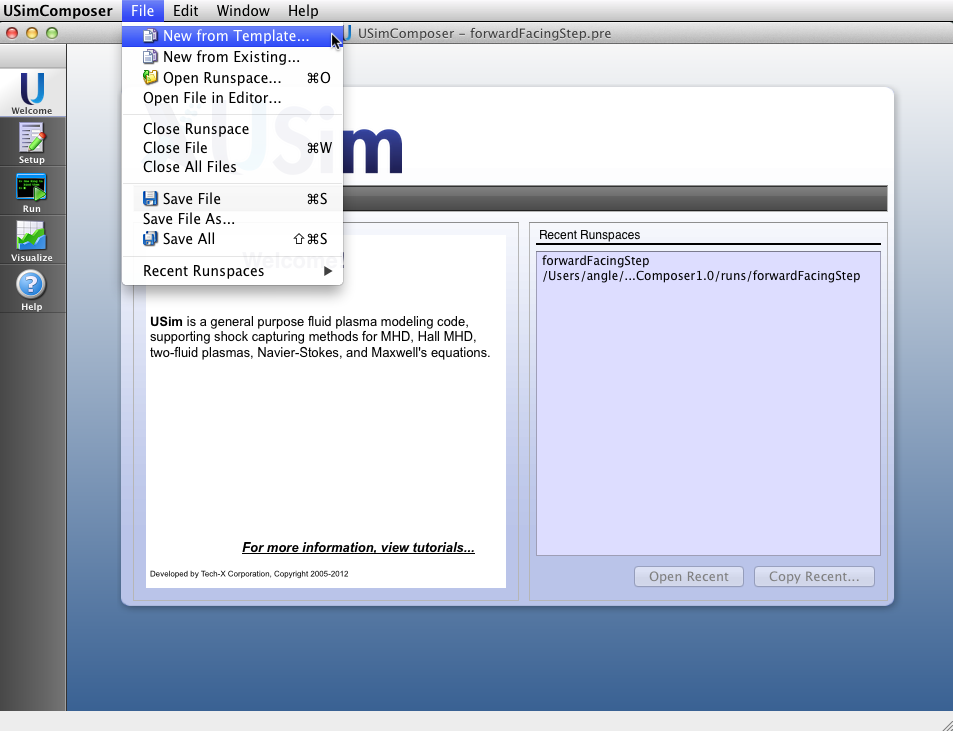
To run one of the examples in USim, one must first create a runspace from the many templates that come with USim. There are two ways to create a runspace from one of the templates. The first is to choose “New from Template...” from the File menu. The second is in the Setup Window. In the Setup Window, click on the New button next to New From Template... in the middle of the Setup Window. See Setup Window.
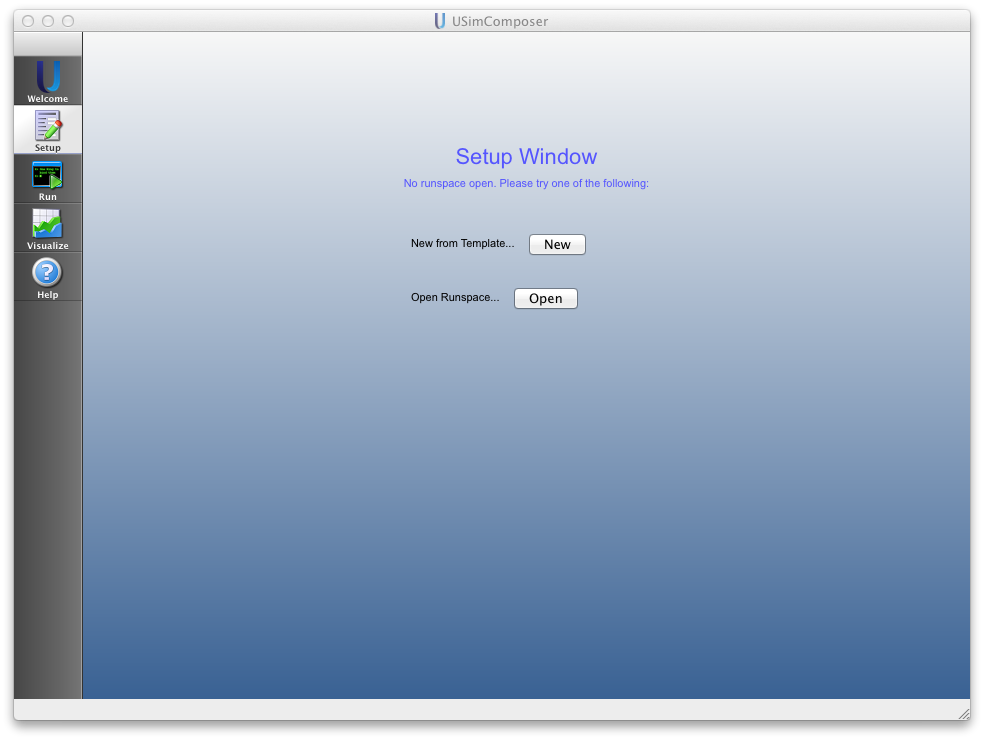
Figure 24: Setup Window
Select Example Template
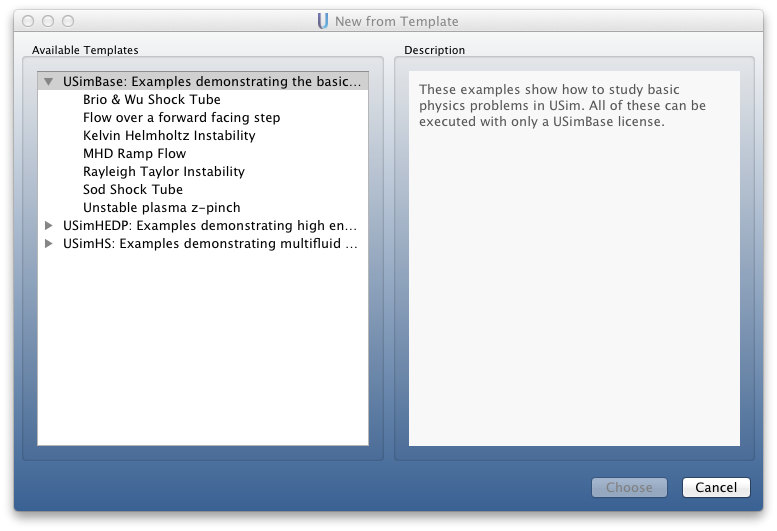
From the “New from Template” dialog, choose a new example template from one of the packages. Only those templates which you have licensed will run, though all examples will still be shown.
If you have clicked once on your selection in the Choose Example pane, your selection is highlighted. Now click on the Choose button in the lower right area of the New from Template window as in Selecting an example from the “New from Template” Dialog. Alternatively, you could double-click on an example name and USim will behave the same as if you had selected the example and then the Choose button.
For this example we will use the “USimBase - Flow over a forward facing step” example.
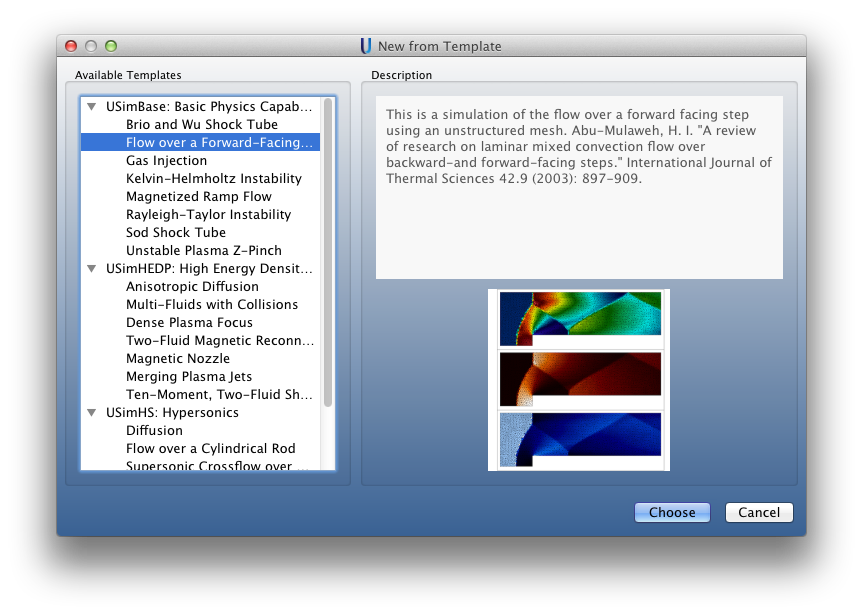
Figure 25: Selecting an example from the “New from Template” Dialog
Choose a Name for the New Runspace
The window Choose a name for the new Runspace allows you to choose
the directory to which the example files will be copied from the template.
The default name of the directory is displayed in the FileName
field. For this example, the default name is forwardFacingStep. If you
want to use a different name, you may type a different name into the FileName
field. When you are satisfied with the directory name and location, click
the Save button to proceed.
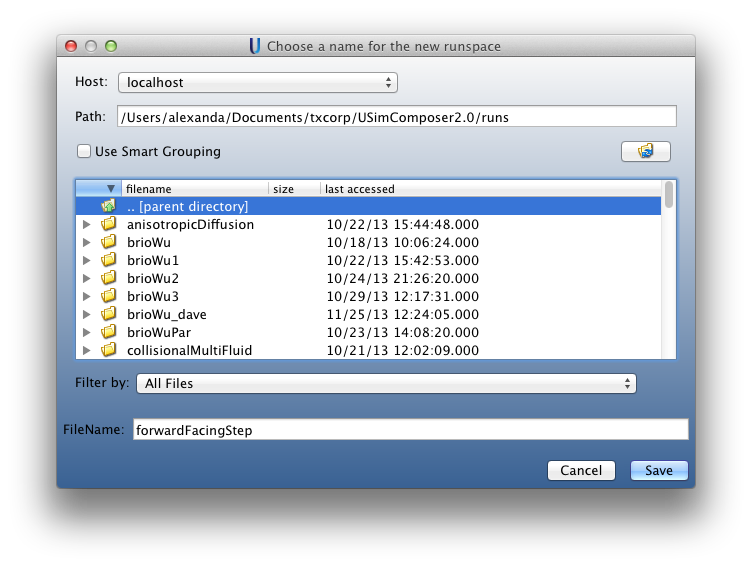
Figure 26: Create Directory to Use for Runspace
Using the Setup Window
After you choose the name for the runspace, USimComposer displays the Setup Window containing a Navigation pane on the left and an Editor pane on the right. The workflow panel remains available on the far left.
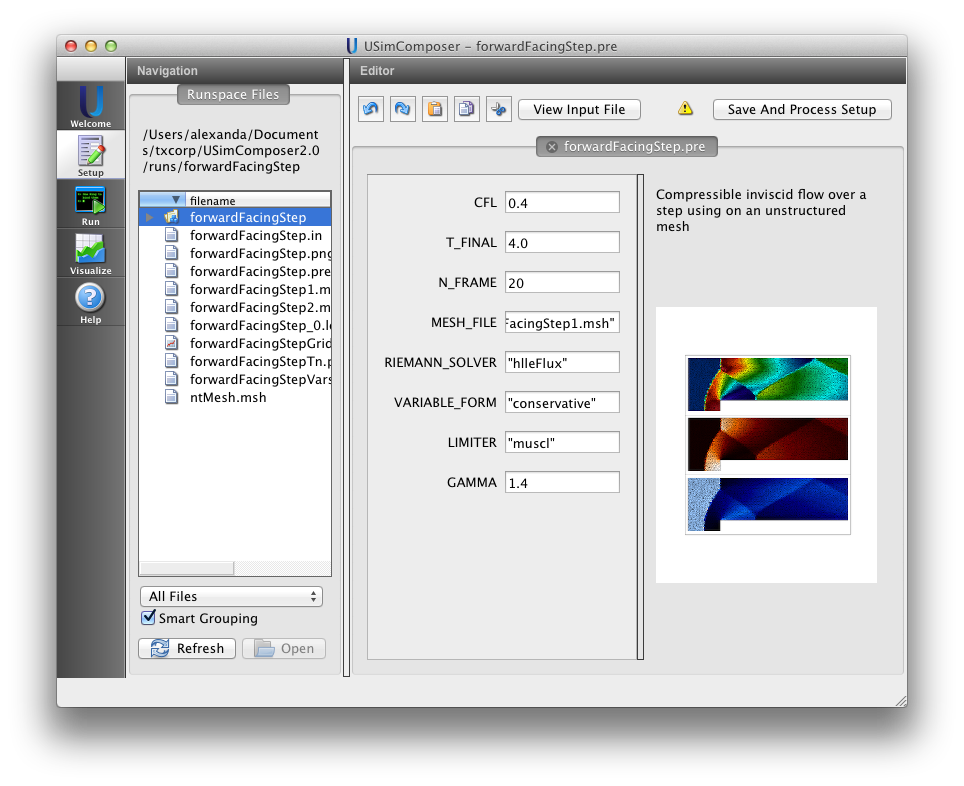
Figure 27: Setup Files Tab
Below the Runspace Files tab in the Navigation pane you will find a pulldown menu for which files are shown, which defaults to All Files and a toggle choice of Smart Grouping, which is on by default. These menus determine the format in which files will be displayed in the Files tab. Depending on how complex a simulation is, there may be multiple files used in a simulation, including the input file, macros, and python geometry files. Many more files produced during the simulation run at each time step of the run.
To enable convenient viewing of the list of simulation files, USim allows you to specify in what order as well as which type(s) of files you would like to view. Smart Grouping causes similar types of files to be displayed in the same area of the Files tab list. Turning off Smart Grouping causes files to be displayed in alphabetical order rather than by type. All Files indicates that you want to see all available files involved in the simulation. You could choose to limit your view to only Runspace Files, which are files such as input files and macros that can be edited in the USimComposer Editor pane, or Text files, which include all types of human-readable file formats, or Data files, which include incremental dump files and output files that can be visualized.
File name filtering with these pull-down menus is illustrated later in this document in the Visualization Pane section, Results Pane.
In addition to Runspace Files, the Setup Window holds the tab to change the key parameters for a run and the Save and Process Setup button. See The main parts of the Setup Window.
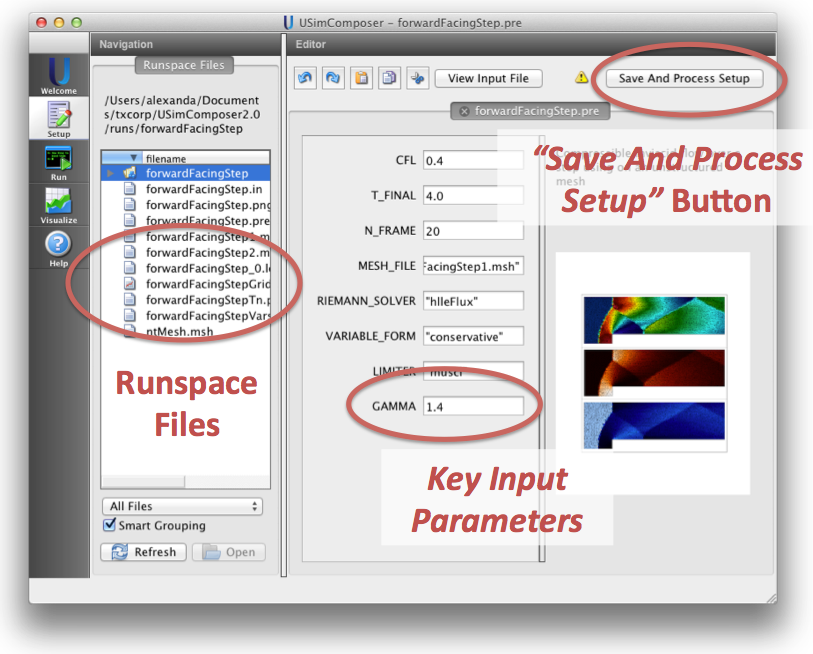
Figure 28: The main parts of the Setup Window
Click on the Save and Process Setup button in the upper right corner of the USimComposer Setup window to validate the input before running USim.
Key Input Parameters in the Setup Window
All the example files in USimComposer come with key parameters allowing the user to easily adjust basic parameters of the simulation. The default setup window will show the key input parameters interface and an image of what the simulation looks like. By holding the mouse over the key input paramater title, a description of what exactly the variable does will pop up. Many examples can actually be significantly modified with just the key input parameters and extended for slightly different applications.
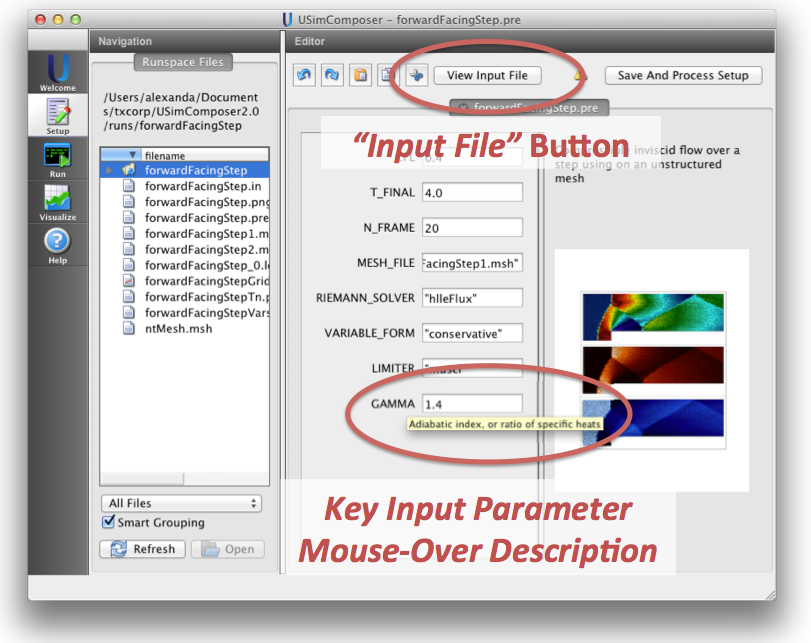
Figure 29: Key input parameters or the full input file can be edited in the Setup Window
If you would like to see the actual input file, simply click on the View Input File in the upper left hand side of the Editor pane. This will bring you to the traditional .pre file.
Save and Process the Input File
Click on the Save and Process Setup button in the upper right corner of the USimComposer Setup window as illustrated in the image below.

Figure 30: Save and Process Setup Button
View the Output Messages
USim notifies you of the actions that it is taking in a new window that USimComposer opens in the lower portion of the Editor pane.
Notice that this new window contains three tabs: a Find/Replace tab an Output tab and a Results tab. If you had clicked in any tab of the Editor window, the Find/Replace tab would have appeared to assist you with editing the file. The Output tab notifies you each step of the way as to what USim is doing as illustrated in Setup Window tab for output message.

Figure 31: Setup Window tab for output message
Run
Select the Run Window
When your Save and Process activity completes successfully, USim reminds you that you can now proceed to the run part of the workflow. To do this, click on the Run button in the workflow panel on the far left of the USimComposer window (see Setup Window showing main USimComposer parts.).
Using the Run Window
As in the USimComposer Setup window, the USimComposer Run window contains two panes. As displayed in Run Window Figure, the Runtime Options window on the left contains a Standard tab and a MPI tab. The Logs and Output Files pane on the right contains a Engine Log tab on the left and a File Browser tab on the right.
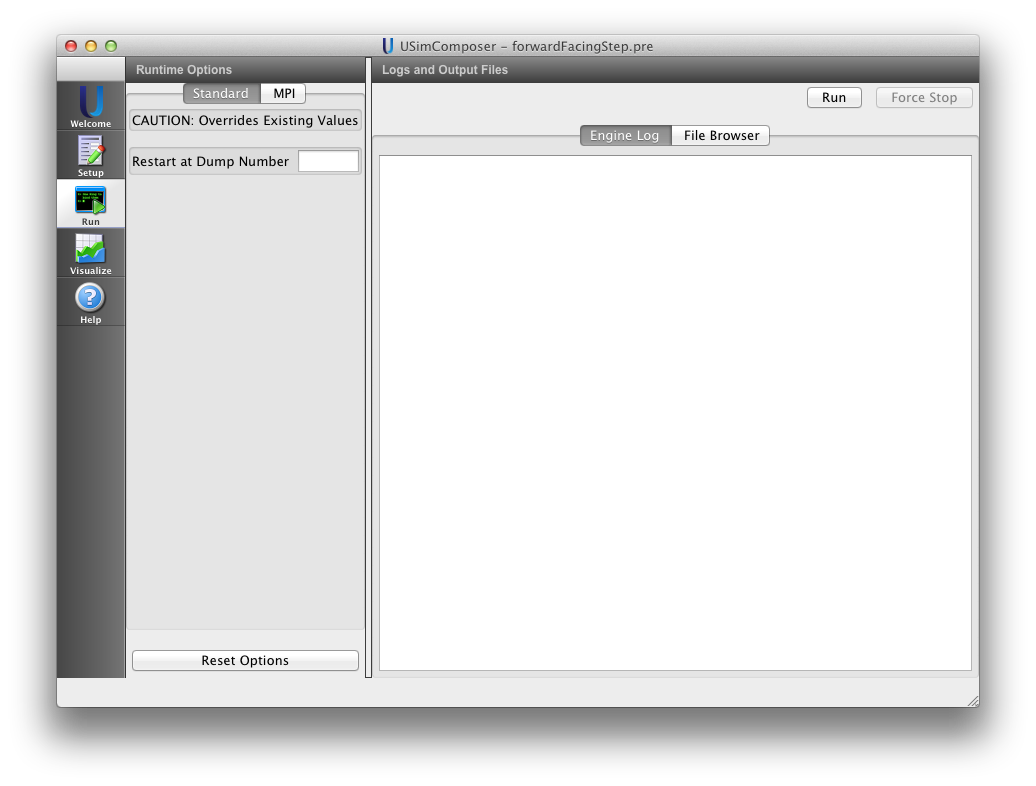
Figure 32: Run Window Figure
MPI (Parallel Execution) Options
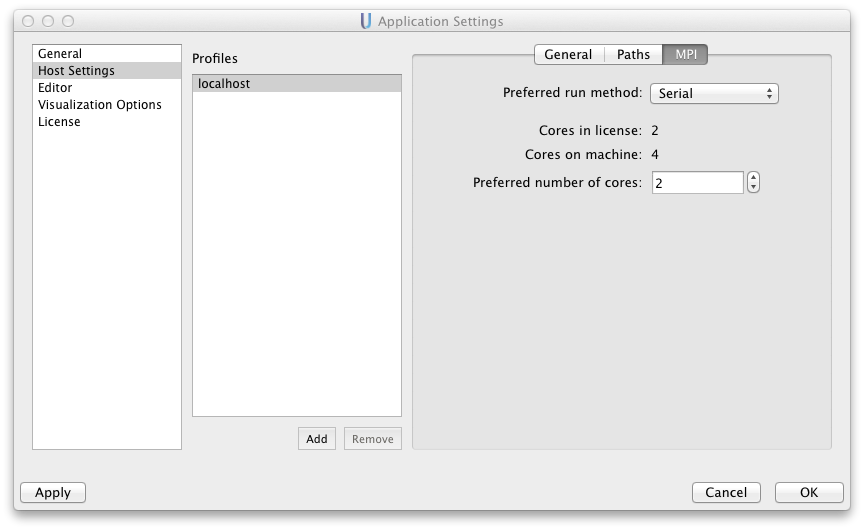
USimComposer runs simulations in serial by default. If you are running on a local system with multiple cores, you can run your simulation in parallel as multiple processes. The simplest method to tell USimComposer to run simulations in parallel is to switch the number of processors to run in the Run window. In the upper-right portion of the Runtime Options pane, there is a tab MPI. Here you can define the number to as few or many processes you want to run. If the Run with MPI button is unchecked the simulation will run in serial mode. See Host Settings for a description of how to set USim to run in parallel by default.
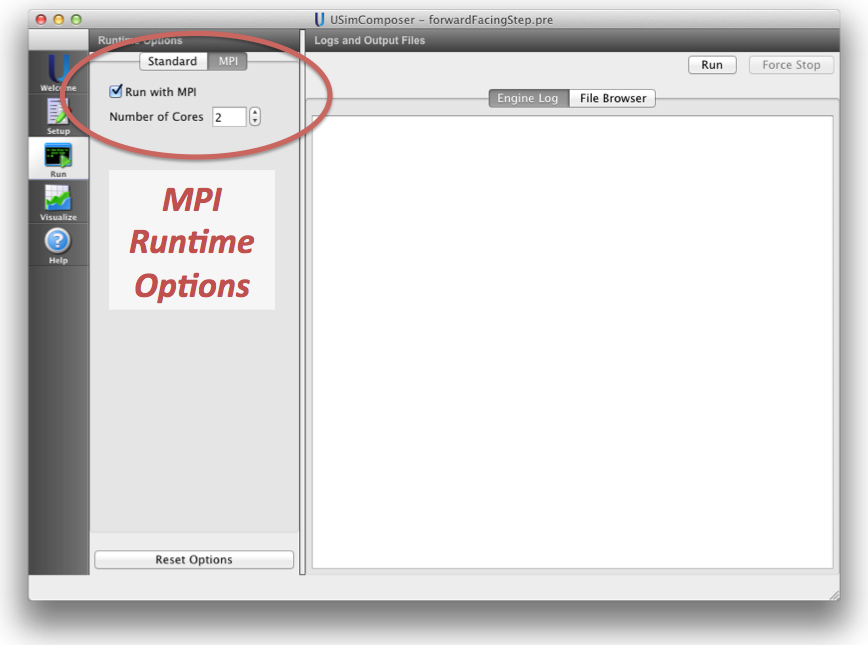
Figure 33: MPI Options
View the File Browser Tab in the Logs and Output Files Pane
In the previous step the File Browser tab was located behind the Engine Log tab in the Logs and Output Files pane. Click on the File Browser tab to bring it to the front as shown in File Browser Tab in Logs and Output Files Pane.
Notice that as with the File Browser in the Setup window, the File Browser in the Run window also has the Smart Grouping and All Files pull-down menus at the bottom of the tab.
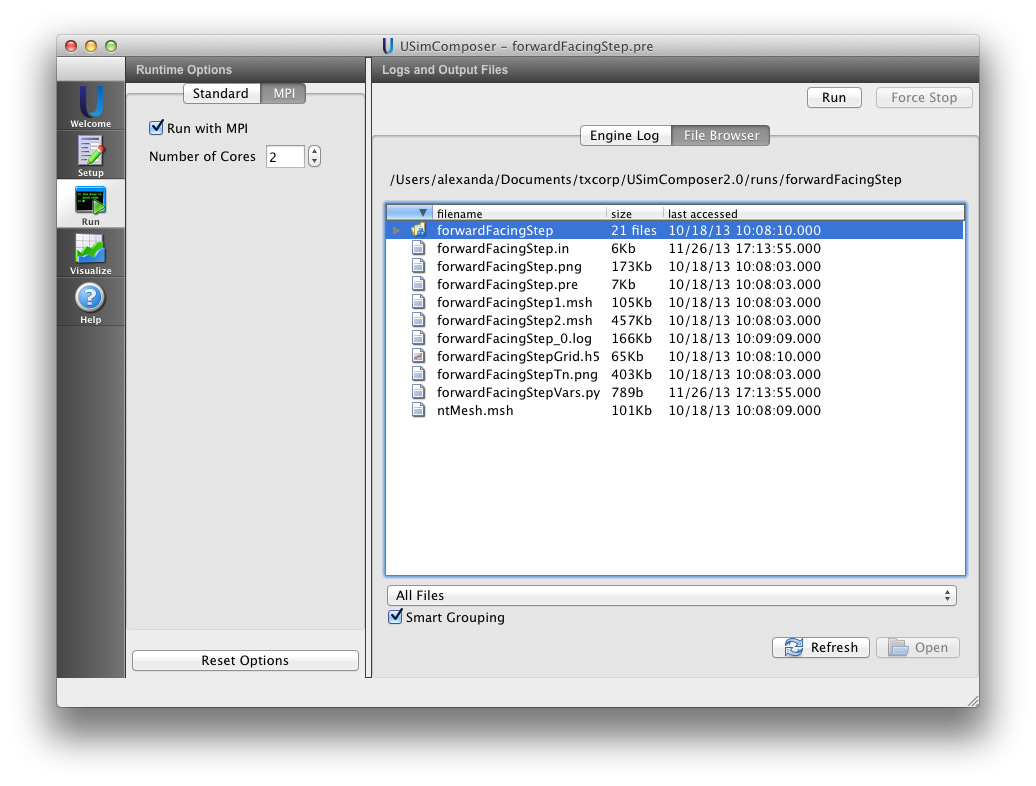
Figure 34: File Browser Tab in Logs and Output Files Pane
Run the Simulation
For our example, we’ll run this simulation using only the default existing settings from the input file.
You do not need to select any file in particular in the File Browser tab before clicking on the Run button. However, if the File Browser tab display area is too narrow for you to see the full file names in the filename list and you would like to see the file name extensions of the files in the file browser, you can adjust the width of the filename field by using your mouse.
Click on the Run button at the top of the Logs and Output Files pane as shown in Run Button.
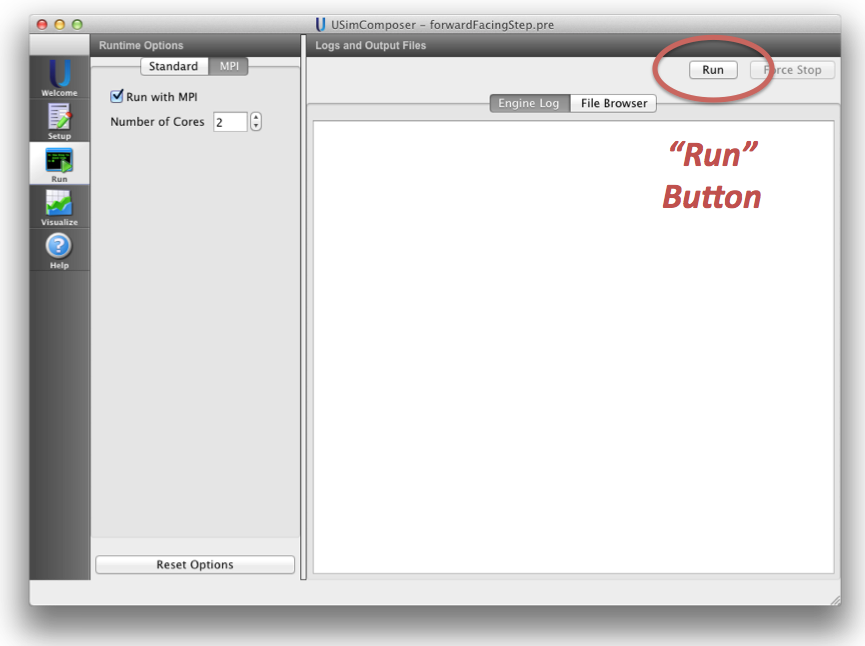
Figure 35: Run Button
Stopping the Simulation
USimComposer features the ability to Force Stop a simulation. The button for this action is located next to the Run button (see Run Button).
If a Force Stop is used the field and history data will NOT be written to a .h5 file before the simulation stops. The output of a successfully force stopped simulation is given below.
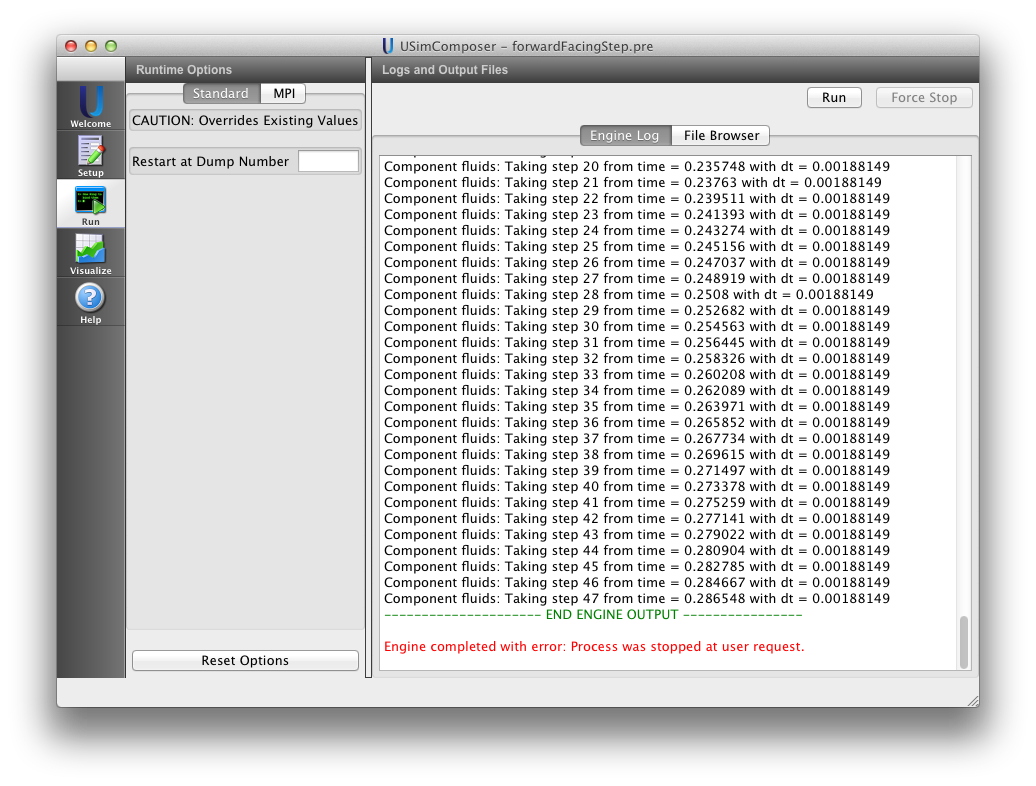
Figure 36: Force Stopped Simulation
Restarting a Simulation
With USimComposer it is possible to restart a simulation that has been paused, or ended. This is useful if it is desired to add more time steps to the initial simulation, or if the simulation had been stopped in the middle of the run. Underneath the Standard tab of the Runtime Options pane of the run window there is a Restart at Dump Number field. Simply put in the last memory dump of the simulation and click on the Run button, like running a normal simulation. This process is demonstrated in the figure below.
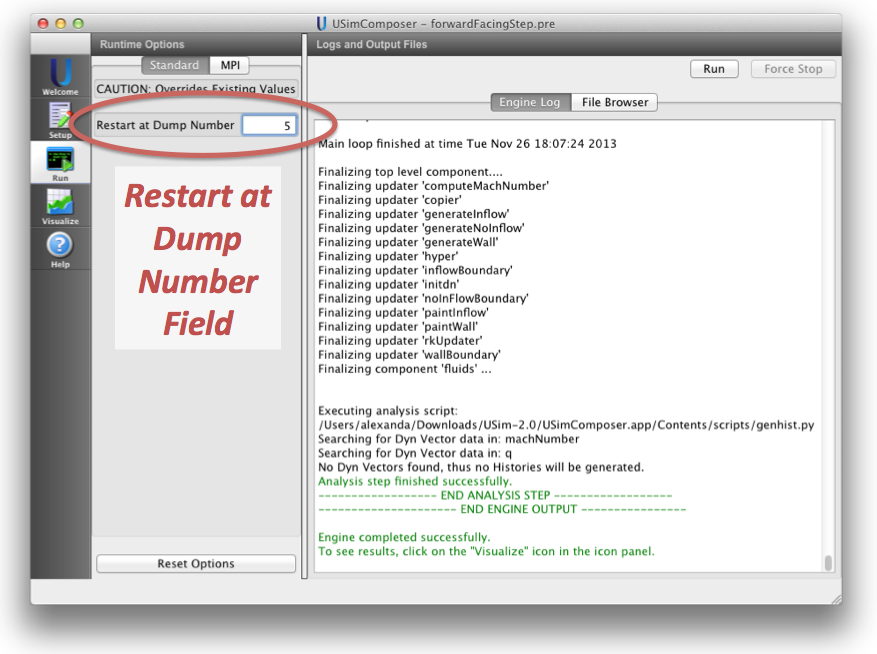
Figure 37: Restarting a Simulation
View the Engine Log
Just as when processing the setup, USim again notifies you of the progress of its activity by reporting results along the way in the Engine Log tab as shown in Engine Log. If the tab display area is full, scroll down to the bottom of the tab.
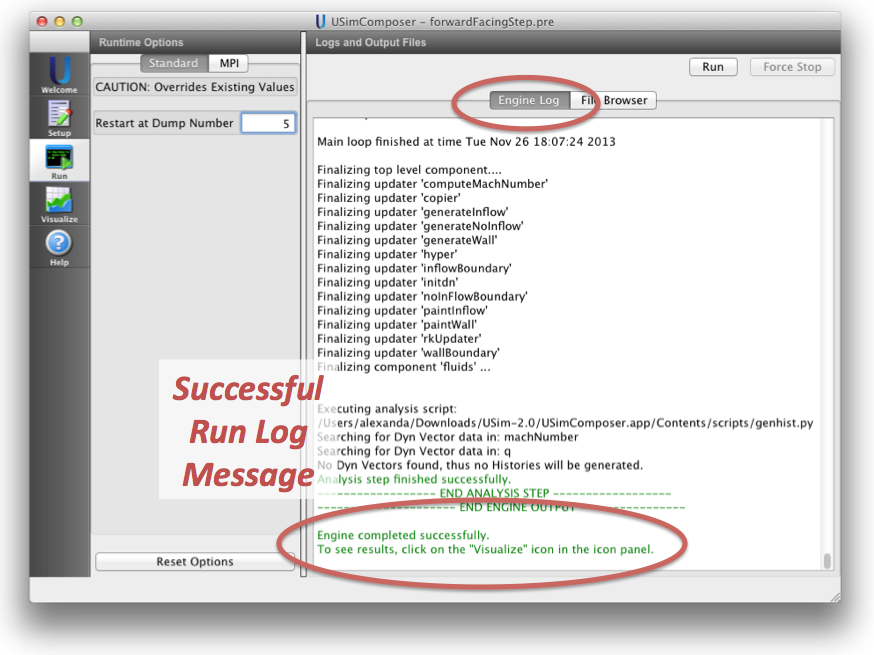
Figure 38: Engine Log
Visualize
Selecting the Visualize Window
Notice that upon successful completion of the simulation run, the last message in the Engine Log tab is a reminder that you can now select the Visualize button from the workflow panel on the far left of the USimComposer window as seen in Engine Log. Remember that you may need to scroll down the Engine Log tab to see the completion message.
Visualize the Current Runspace Data
The simulation was successful and the next step is to visualize the data, Click on the Open Button in the Visualize Window.
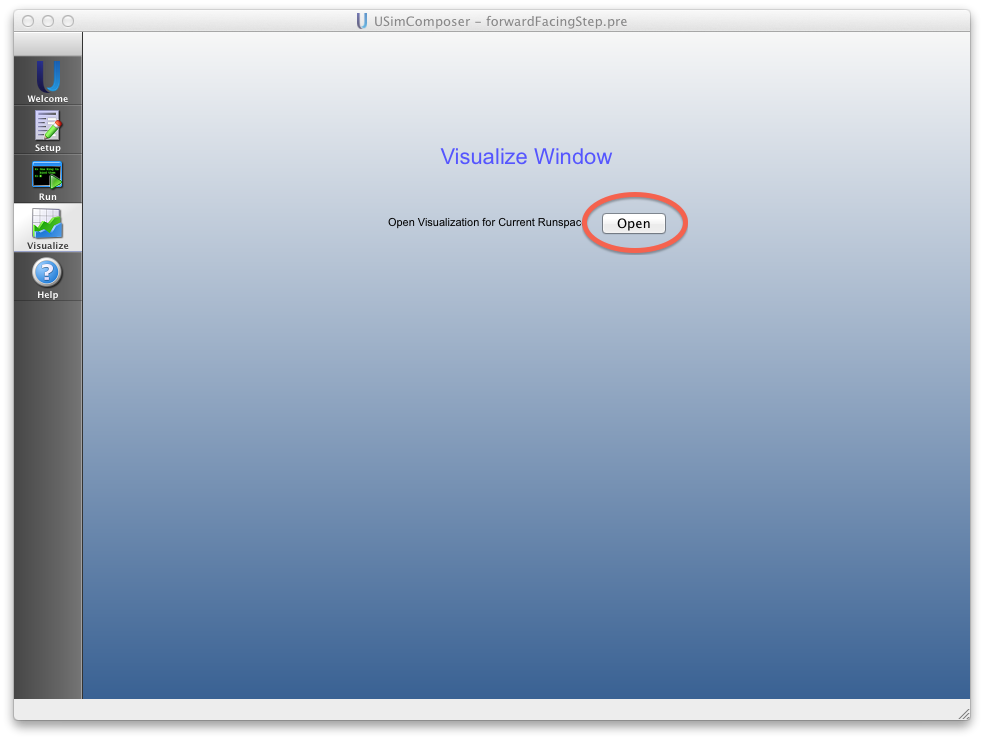
Figure 39: Visualize Window Open Button
Data Visualization Window
USimComposer’s Visualization feature is a flexible and comprehensive model viewer based on VisIt. The simulation tutorials and examples in USim Quick Start provide several examples of using the Visualization feature’s options in context.
The Visualization window is divided into a Controls pane on the left and a Results pane on the right.
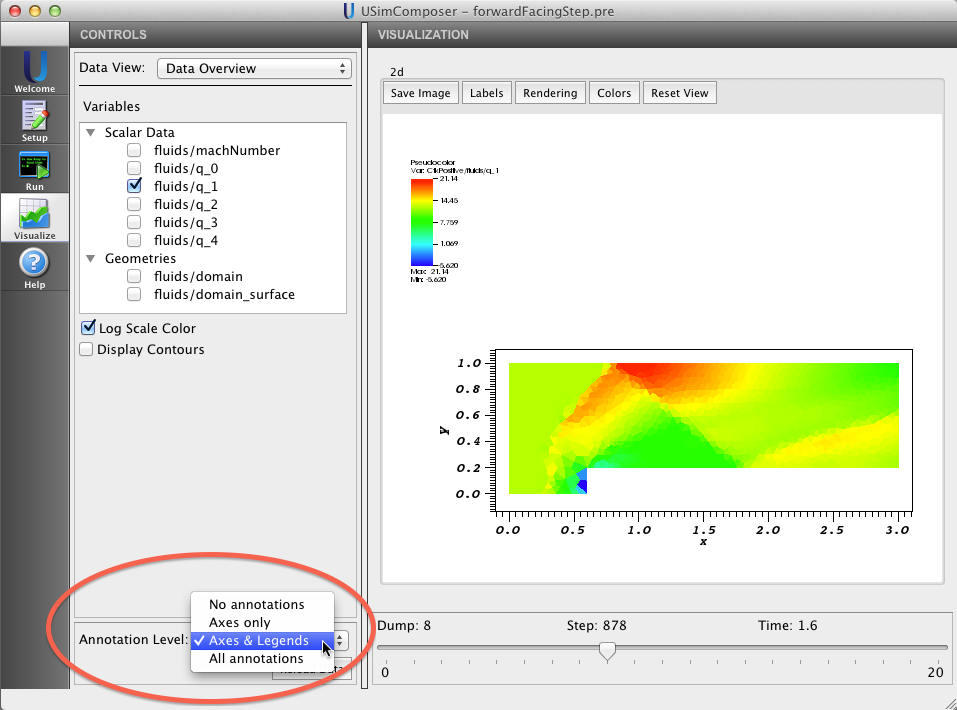
As displayed in Controls and Results Visualization Panes, click on the right-facing triangle arrowhead next to Scalar Data and Geometries to expand the views.
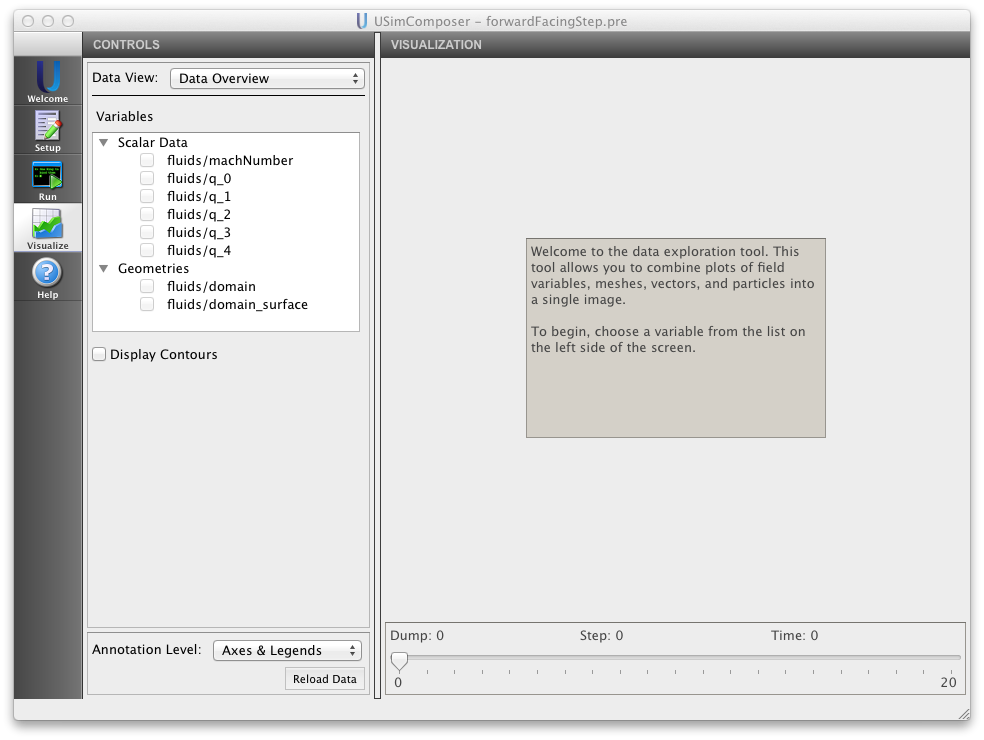
Figure 40: Controls and Results Visualization Panes
Controls Pane

Figure 41: Data View Menu
Variables
The Variables section of the Controls pane enables you to choose which aspects of the simulation data to visualize. The types of variables that are available in the Variables section are dependent on your particular simulation. Below are some typically available types of variables.
Scalar Data
Types of Scalar Data include:
- fluids/machNumber
- fluids/q_n
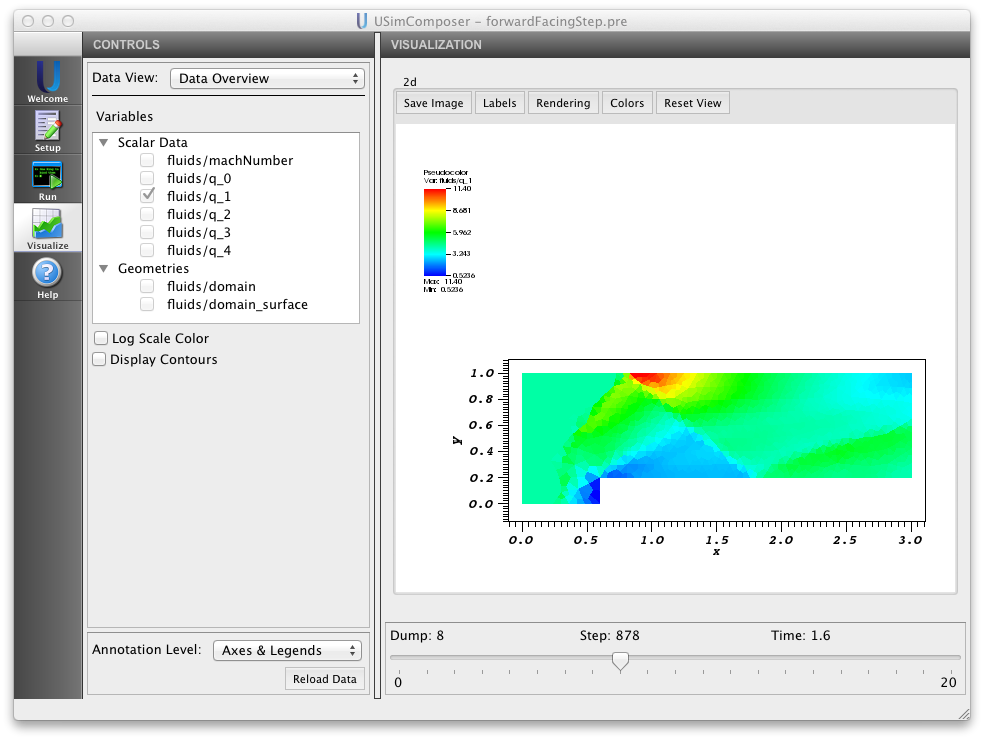
Figure 42: Scalar Data Variables
Note that \(q_0\) is mass density, \(q_1\), \(q_2\), and \(q_3\) are the three components of momentum density, and \(q_4\) is energy density.
Geometries
Types of Geometries include:
- fluids/domain
- fluids/domain_surface
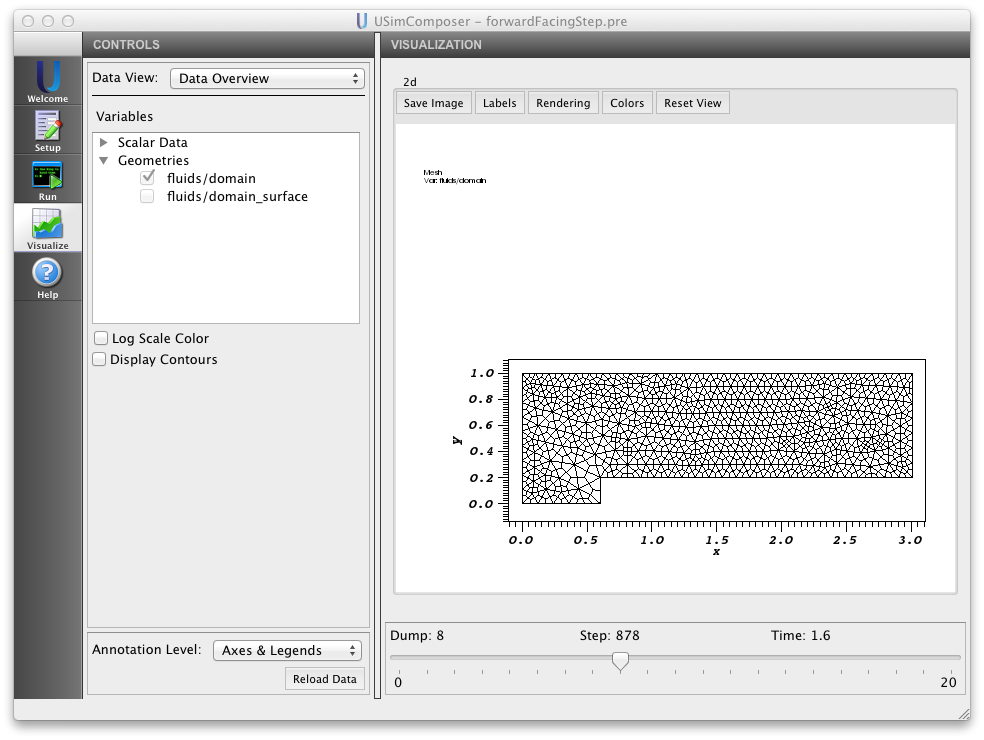
Figure 43: Geometries Variables
Contours (2-30)
The default value in the Contours field is 10. If you select the Display Contours check box and have an approriate data set selected the number of countours can be changed from 2-30
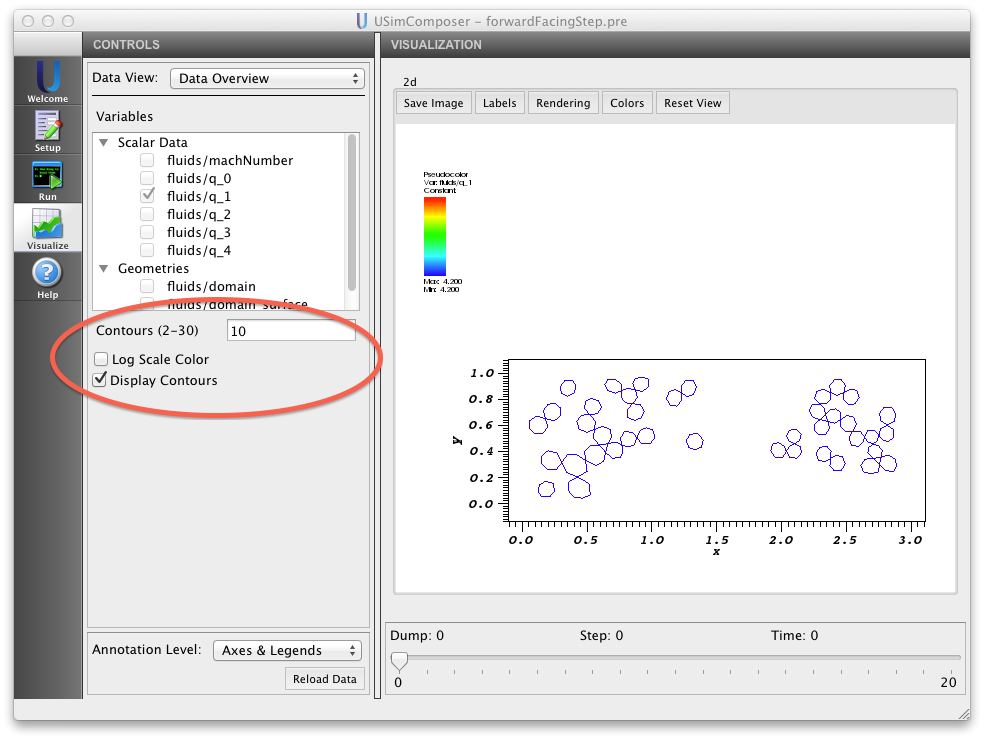
Figure 44: Contours
Log Scale Color Checkbox
If the appropriate field is selected the Log Scale Color checkbox will be available to enable and disable display of log scale color.
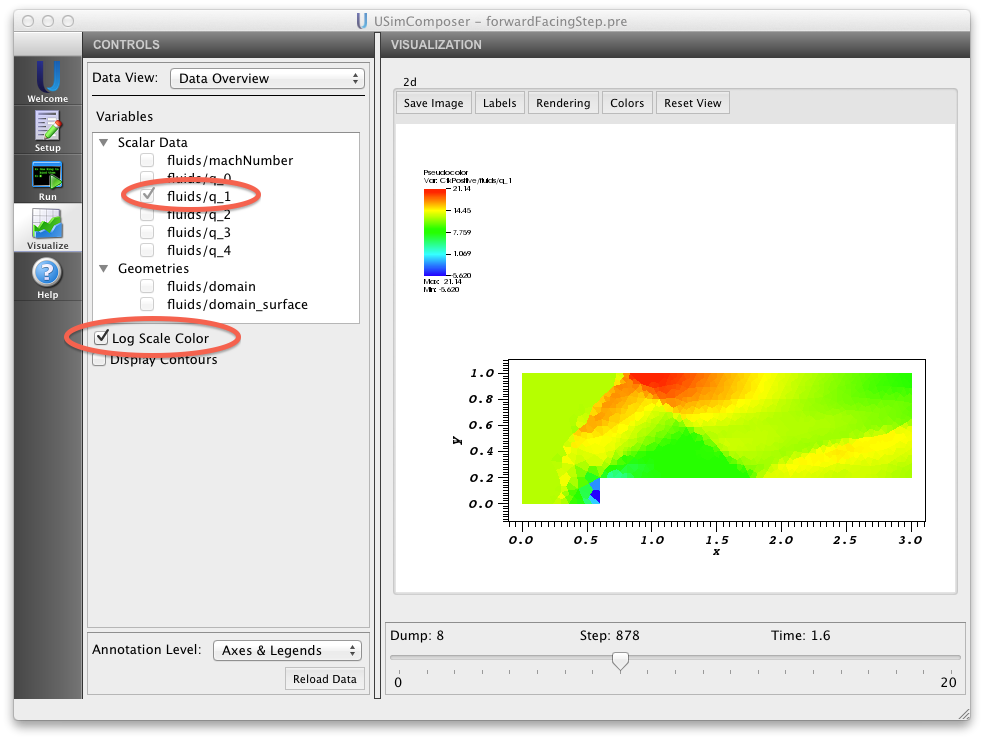
Figure 45: Log Scale Color Checkbox
Reload Data
You can visualize data from a simulation run as soon as it becomes available in the runspace. If you decide to visualize data before a run is complete by switching to the Visualization tool and using the Open visualization from current runspace button in the Visualization window, USim continues creating data files in the background. Later when more data is available for visualization or the simulation run is complete, use the Reload Data button to visualize the new data.
Note
If the first visualization took place when there was only one dump, then the visualization system is completely reloaded, which means that plots are not preserved. However, if the first visualization took place when there was more than one dump, then all current plots and views are available when Reload Data is invoked.
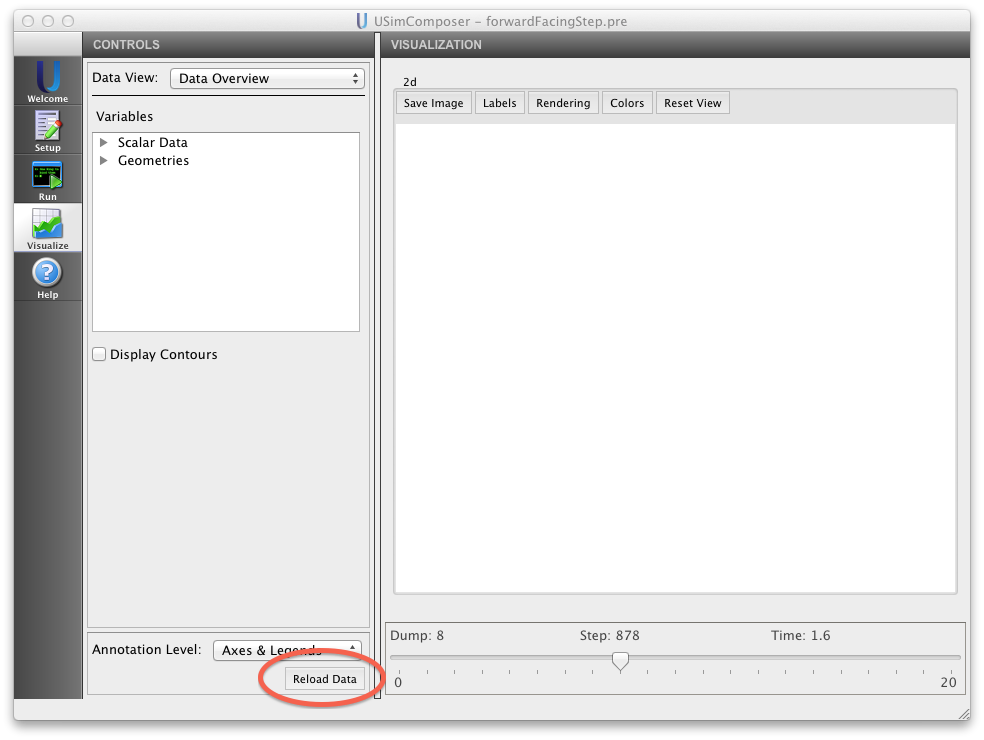
Figure 47: Controls Pane Buttons
Results Pane
The USimComposer Visualization Tool uses a window in the Visualization Results pane on the right side of the USimComposer window to dynamically display data modeled according to the selected variables and other Controls pane visualization configuration settings.
Example Visualizations
The following images illustrate how the various features of the Visualization Tool can be used to control rendering of simulation data to help the user visually explore aspects of the simulation. Notice that the Visualization pane slider is used to adjust values for:
- Dump
- Step
- Time
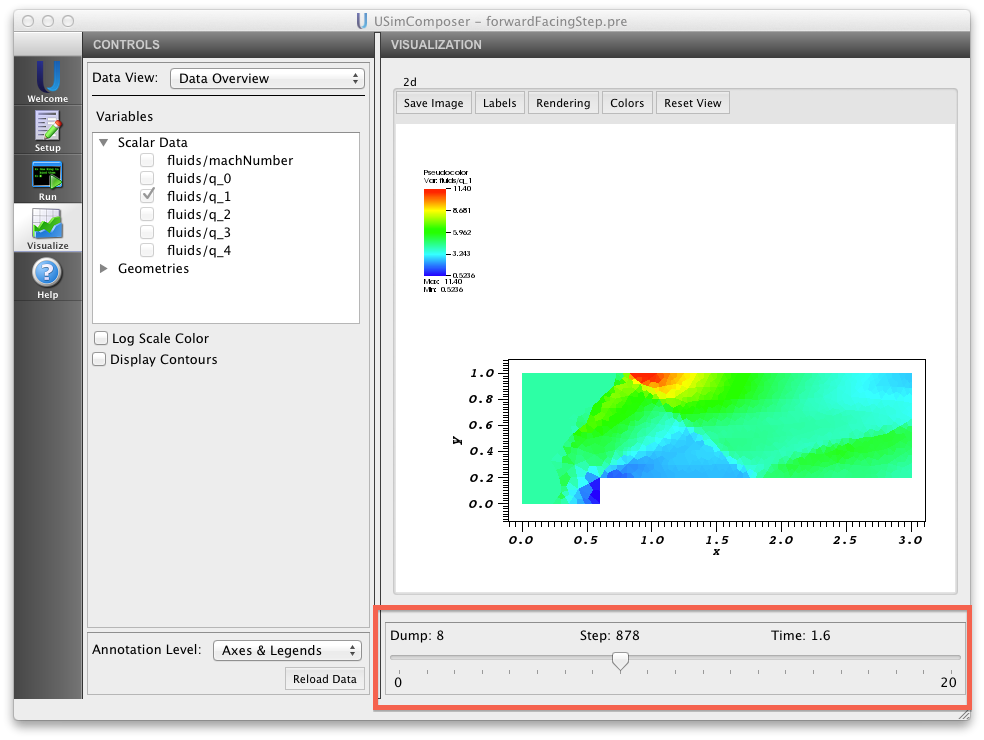
Figure 48: Clip All Plots
Visualize Data from a Previous Run
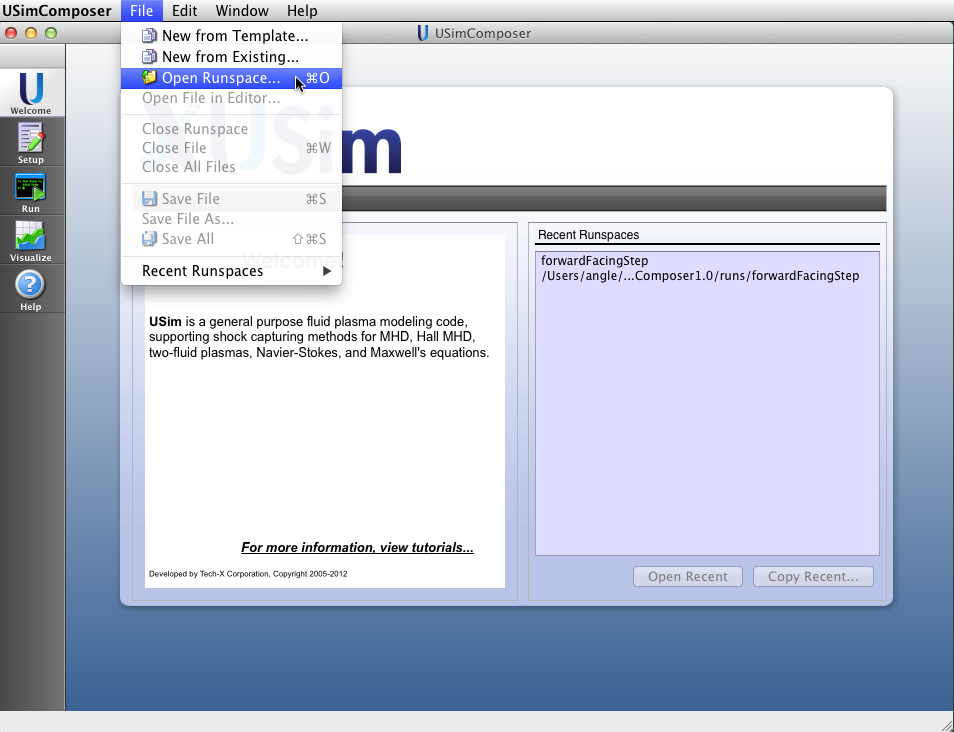
In addition to visualizing the result of a current run immediately after conducting the simulation, you can also visualize data from a previous run. You can access recent simulations using Recent Runspaces in the File menu in the menu bar or the Welcome or you can locate all previous simulations using the Open Existing Runspaces in the Setup Window.
Open an Existing Runspace from the Setup Window
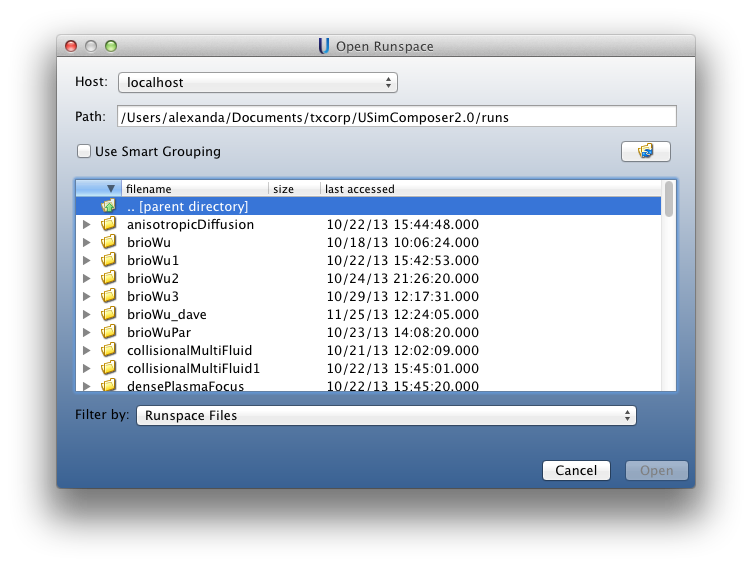
Alternatively, if the simulation data you want to visualize was not produced recently, use the Setup Window instead of Recent Runspaces. Return to the Setup window by clicking on the Setup icon in the icon panel then select the Open button next to Open Existing Runspace as shown in Existing Run Space button.
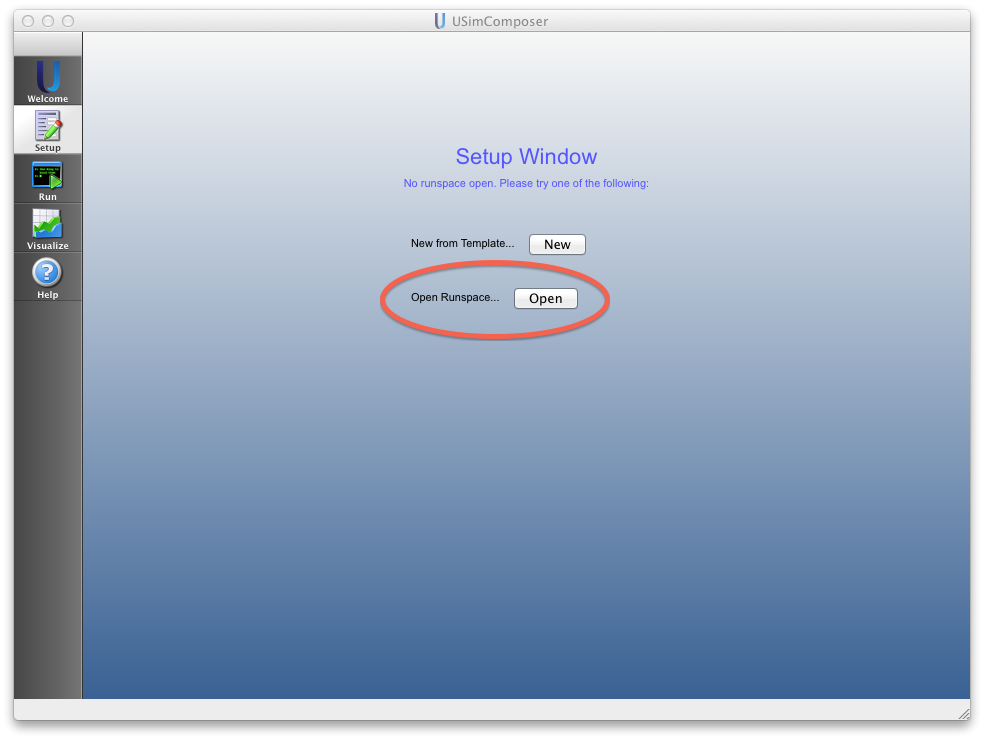
Figure 51: Existing Run Space button
USimComposer displays runspaces from which you may select.
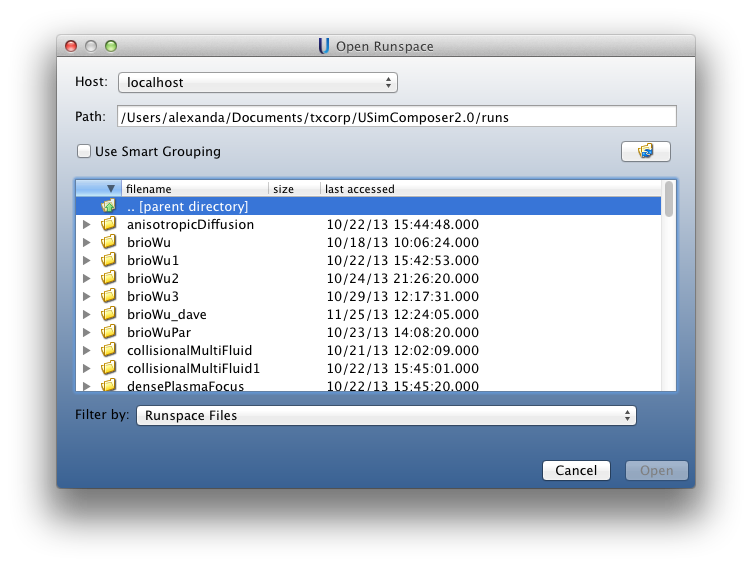
Figure 52: Existing Run Space Selection
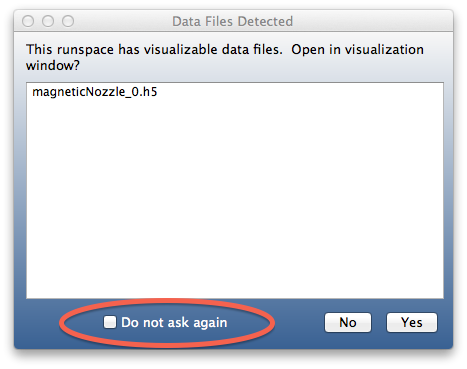
If you did not previously elect not to display detected data files then just as with Open Recent Runspace from the File Menu, USimComposer displays a list of data files that it has detected in the selected runspace, and you can click on the Yes button to visualize the data.
Sorting and Filtering File List Display in the USimComposer File Browser
USim produces several different types of files with each simulation run. To make it easier to examine the files in a runspace, USimComposer provides the ability to sort the file list by file type or file name and to isolate particular kinds of files.
Sorting Files into Groups
The checkbox at the bottom of the USimComposer File Browser enables you to choose whether or not to sort the the list of files in a runspace. Smart Grouping, which is on by default, causes the type of files selected in the adjacent file type pulldown menu to be listed together in logical groups. If not selected, the type of files selected in the adjacent file type pulldown menu to be displayed in alphabetical order.
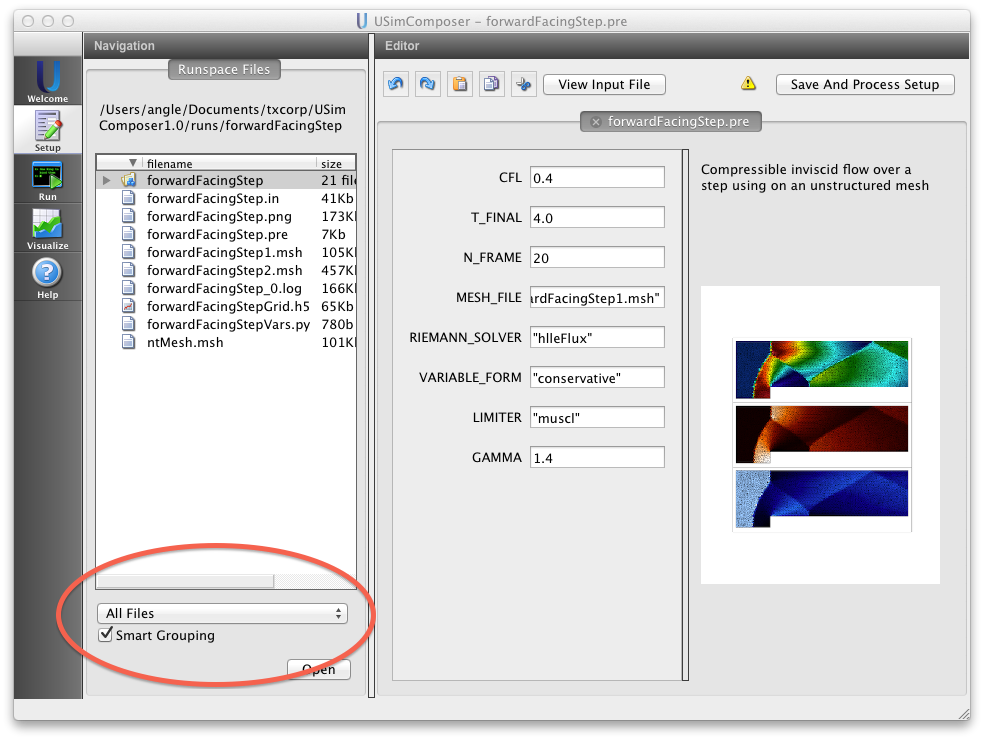
Figure 53: Smart Grouping of All Files
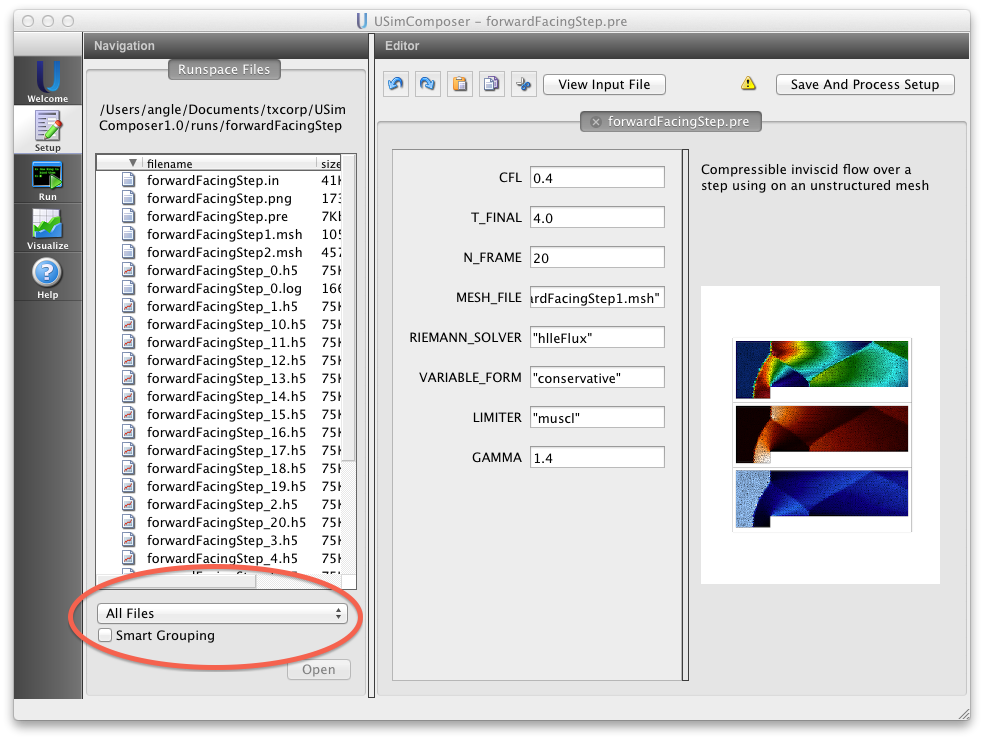
Figure 54: No Grouping of All Files
Filtering Files by File Type
The pulldown menu at the bottom of the USimComposer File Browser enables you to filter the display of files by file type.
All Files, which is the default, causes all file names to be displayed in the grouping indicated by the selected grouping method in the adjacent pulldown menu.
Data Files with Smart Grouping displays the folder containing data files in the runspace.
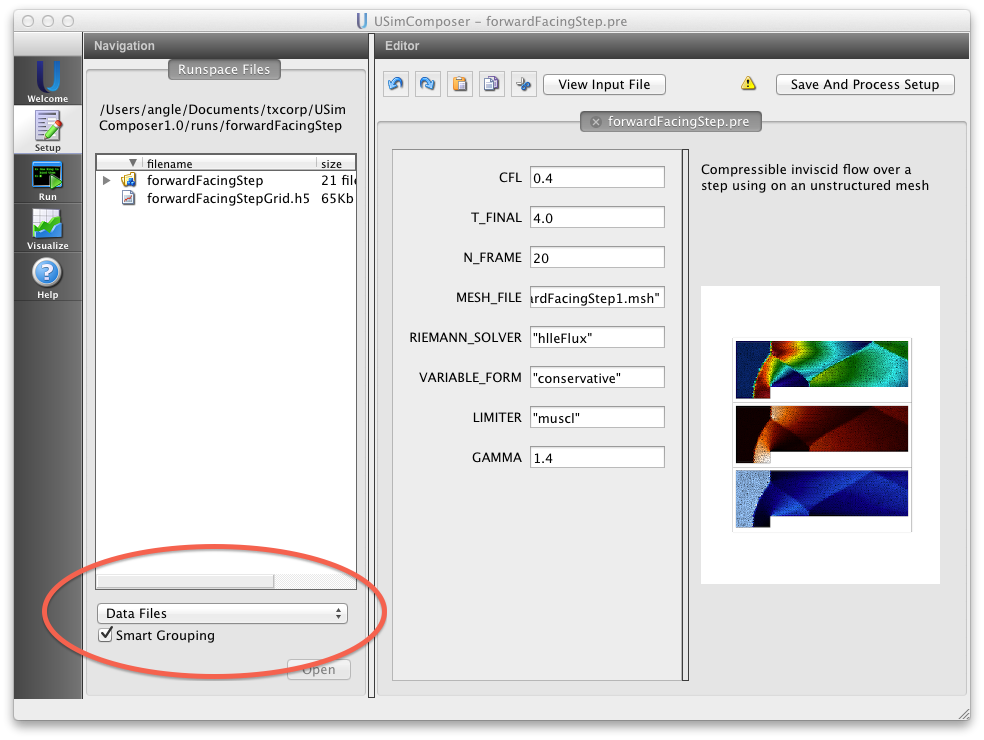
Data Files with Smart Grouping
Data Files with No Grouping displays the names of the data files inside the data file folder.
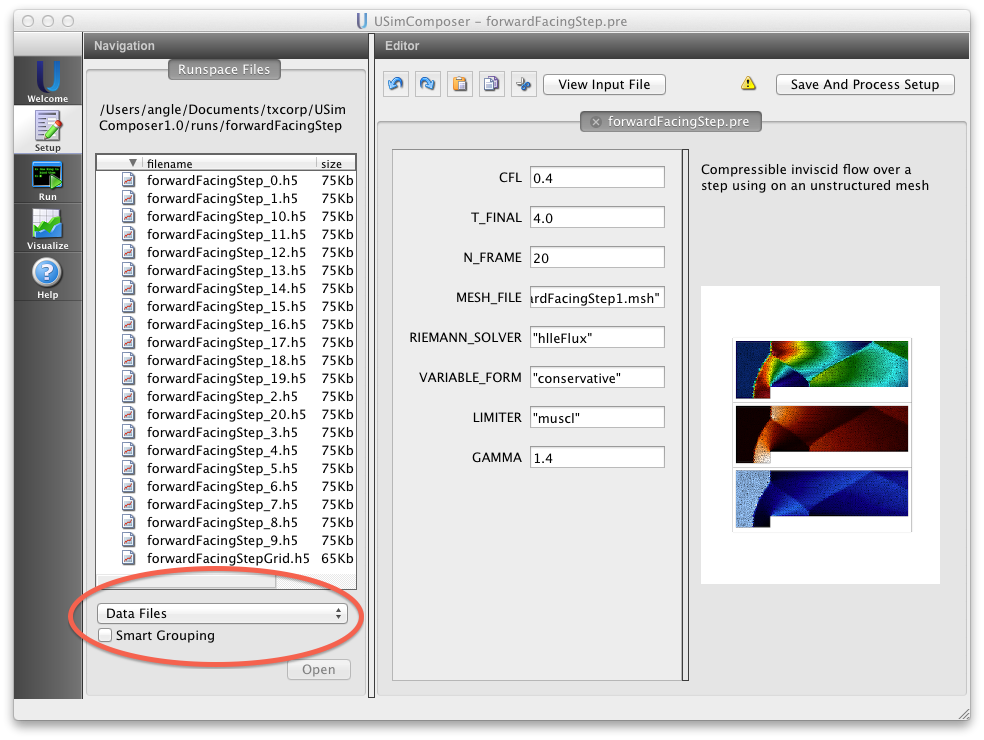
Figure 56: Data files with No Grouping
Other options are Text Files and Runspace Files.
