Space Radiation Simulation
Keywords:
-
radiation, GORAD
Problem Description
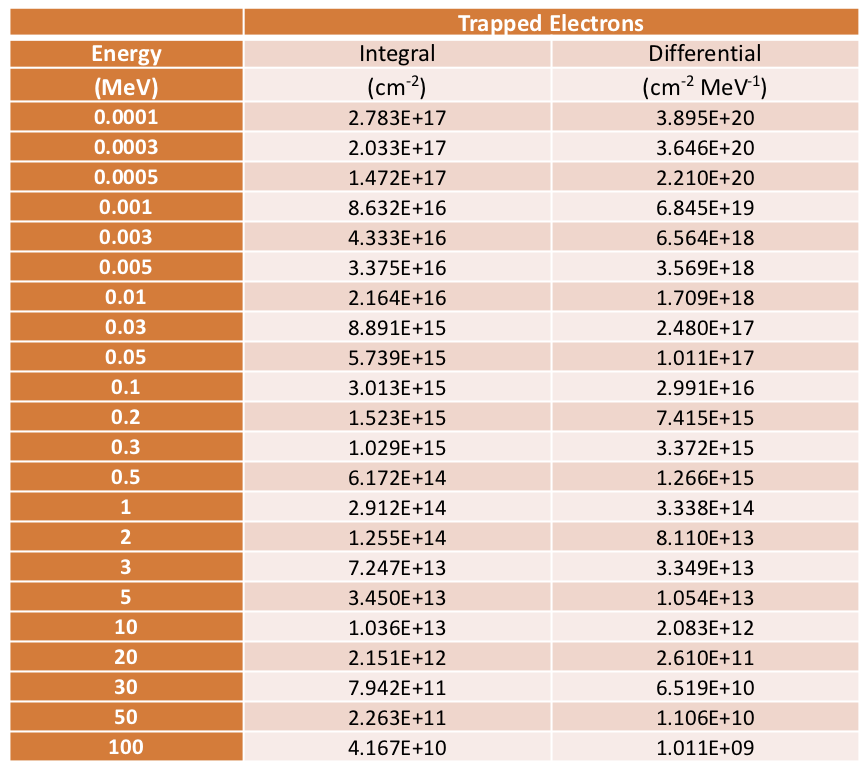
This problem illustrates how to set up a simulation for a typical space radiation environment. Quite often the space radiation is specified in tables with differential and integral flux. An example is shown on a figure Fig. 78.
This differential spectrum is copied into a text file spectrum.txt and is used for the definition of the source. Since the space radiation is omnidirectional, we use cos angular dependency for the source. To make the statistics better the spherical surface used for the source is placed as close to the geometry as possible and the angles are limited by 0 and 90 degrees as shown on Fig. 79.
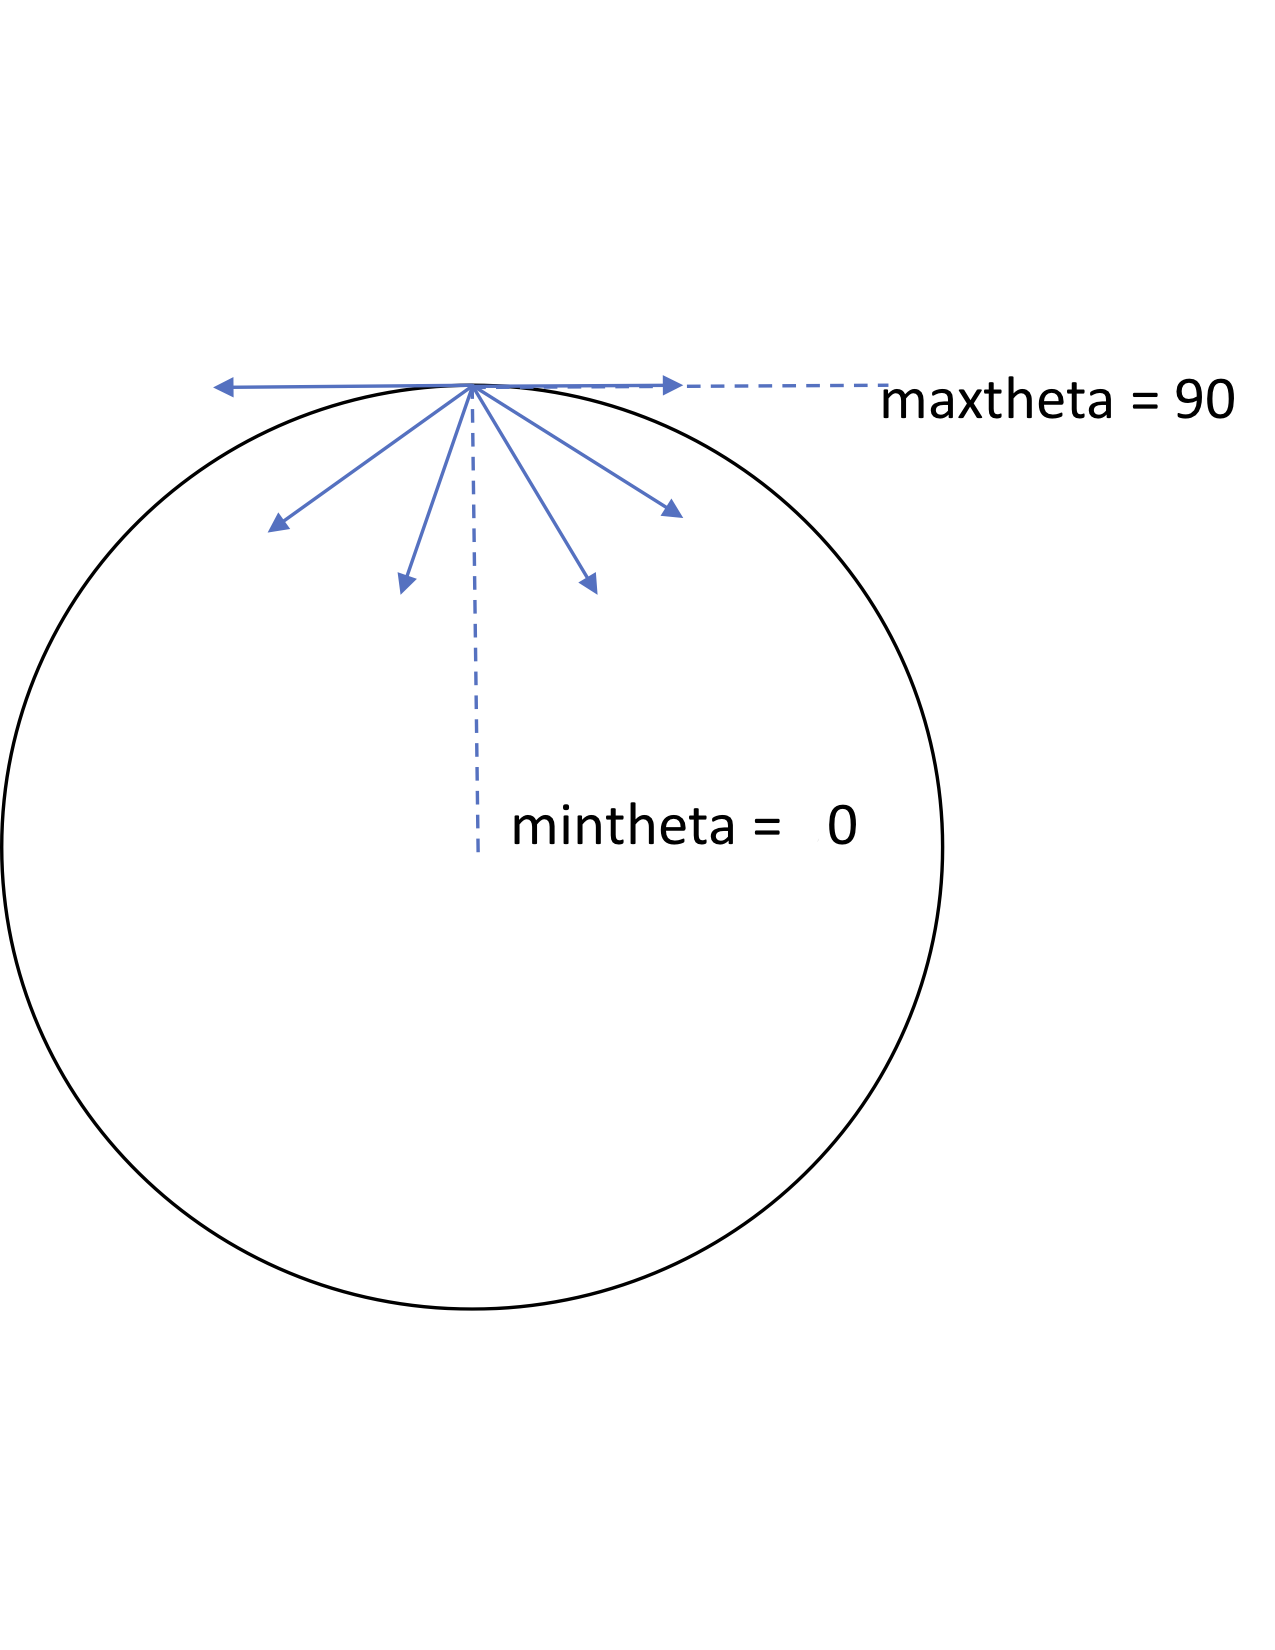
Fig. 79 Space radiation is modeled by an omnidirectional spherical surface close to the target with the particles going inside the sphere, which is controlled by the min and max angle in the source specification. Each point of the sphere emits particles limited by the angles, so particles mostly go inside. One can also make maxtheta smaller to improve statistics.
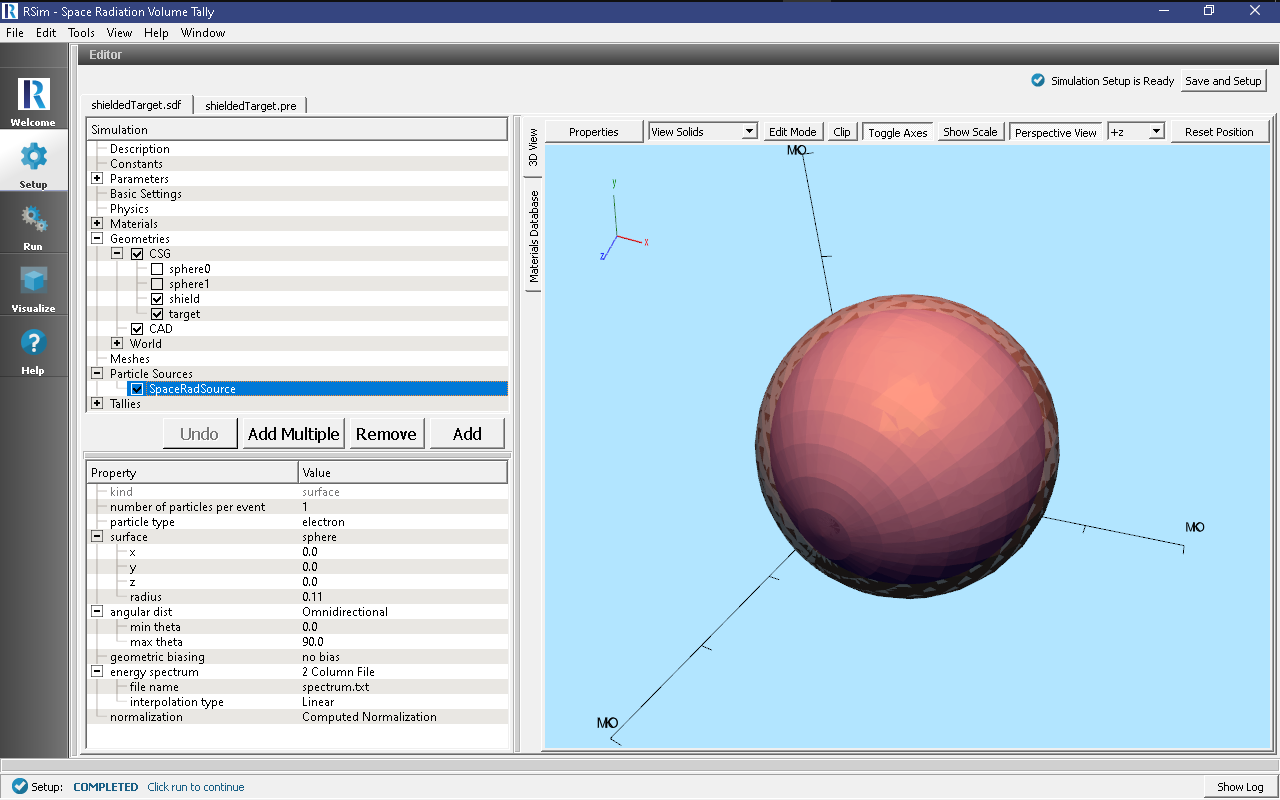
Space radiation source shown in RSim GUI: the spectrum is specified in spectrum.txt file created from the differential fluence data. This is then integrated by GORAD for normalization.
The simulation results are normalized by multiplying the total integral flux calculated by GORAD, the angular factor from the cosine distribution, surface area of the source and then divided by the number of events (beamOn = 1e+7)
The problem geometry consists of a 1cm Silicon target inside a hollow Aluminum sphere with radius 10cm and thickness 1mm.
Opening the Simulation
The shielded target example is accessed from within RSim by the following actions:
- Select the New → From Example… menu item in the File menu.
- In the resulting Examples window expand the RSim for Basic Radiation option.
- Expand the Basic Examples option.
- Select Space Radiation Volume Tally and press the Choose button.
- In the resulting dialog, create a New Folder if desired, and press the Save button to create a copy of this example.
All of the properties and values that create the simulation are now available in the Setup Window as shown in Fig. 80. You can expand the tree elements and navigate through the various properties, making any changes you desire. The right pane shows a 3D view of the geometry, if any, as well as the grid, if actively shown.
Simulation Properties
This example demonstrates two physics features, and how CSG can be incorporated into RSim Simulations.
Under the Basic Settings tab the number of events to be simulated can be selected, as well as the verbosity of the output.
The particle source selected is a spherical surface and simulates 1 electron per event. The energy of each particle is based on a 2 column text file supplied with the example, giving a energy and differential fluence at that energy.
This example has tallies to record the dose deposited on the shield and target, as well as the number of tracks that get absorbed in the shield before reaching the target.
Running the Simulation
After performing the above actions, continue as follows:
- Proceed to the Run Window by pressing the Run button in the left column of buttons.
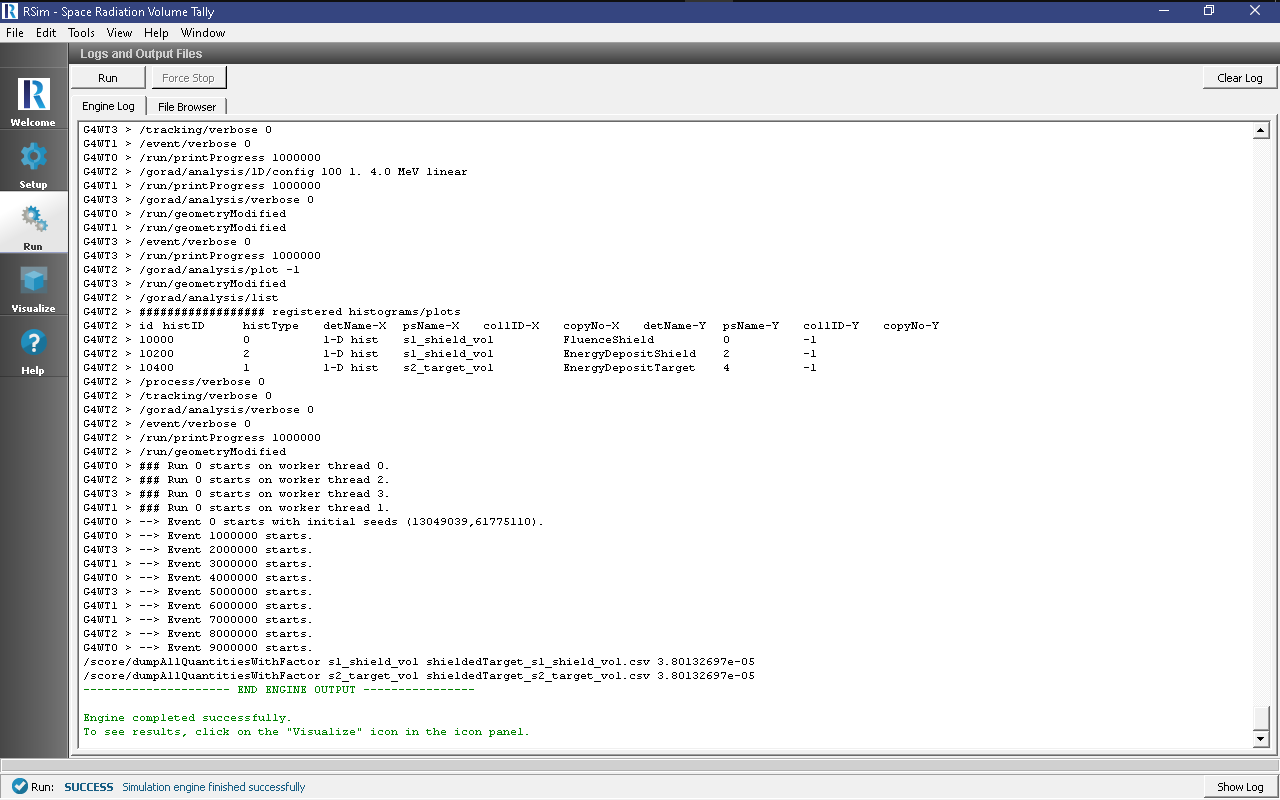
- To run the file, click on the Run button in the upper left corner of the Logs and Output Files pane. You will see the output of the run in the right pane. The run has completed when you see the output, “Engine completed successfully.” This is shown in Fig. 81.
Visualizing the Results
After the run has completed the results of all tallies can be visualized.
- Expand Scalar Data
- Select EnergyDepositShield
- Check Clip Plot
- Select EnergyDepositTarget
- Click Add a Data View
- Choose Data Overview
- Expand Scalar Data
- Choose FluenceShield
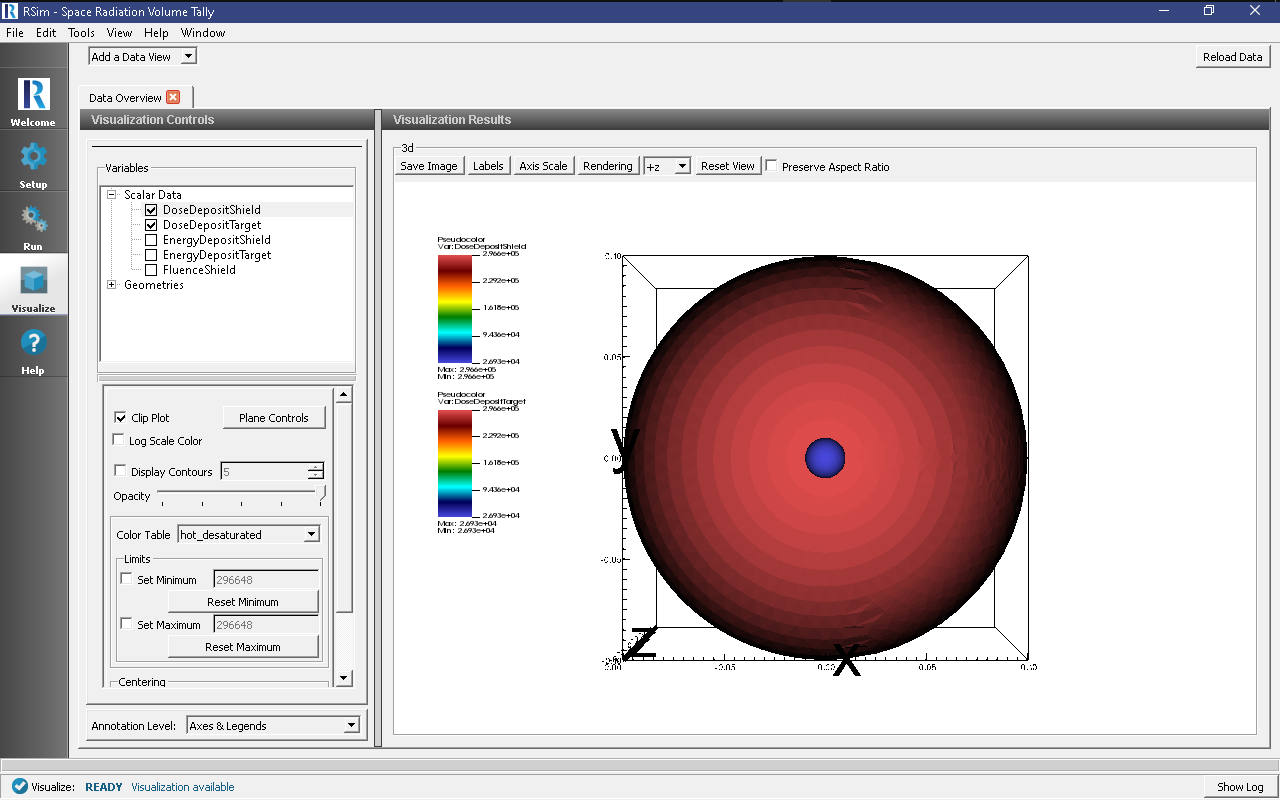
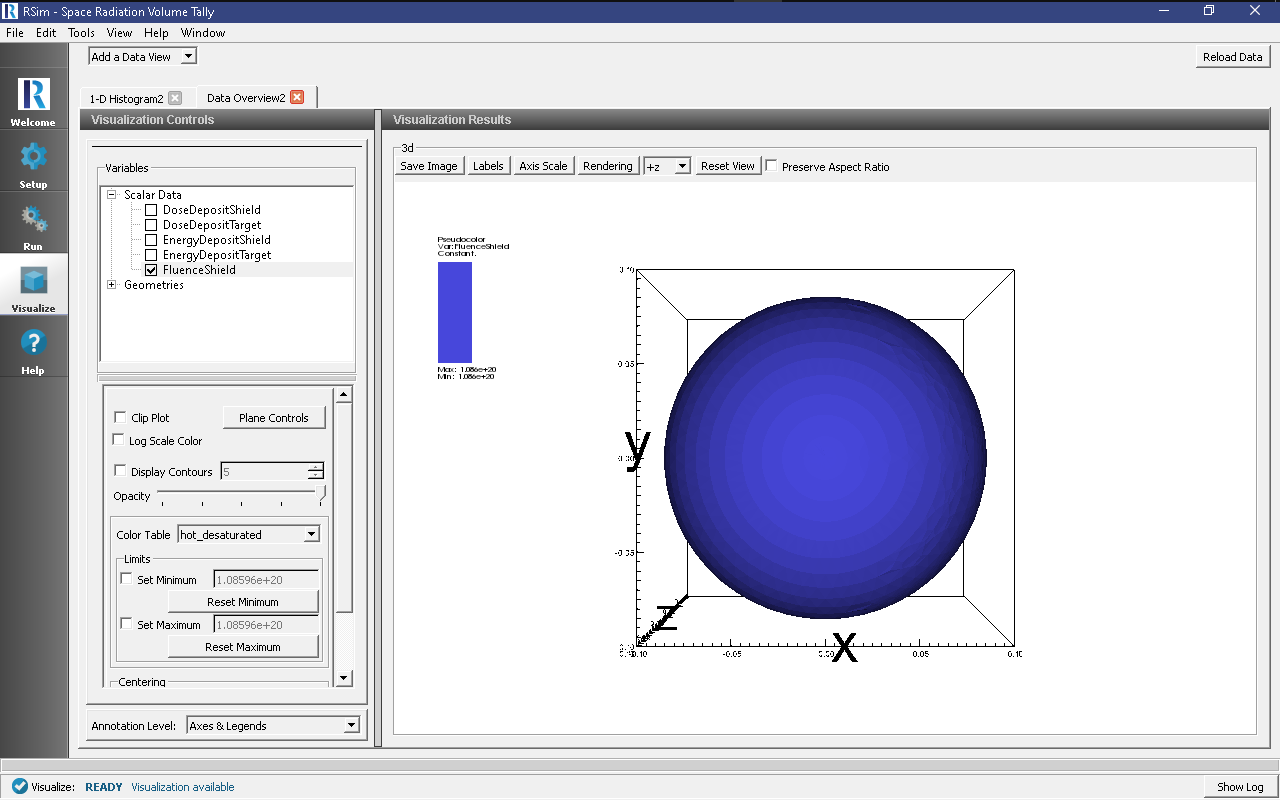
And visualize this result as shown on Fig. 83.
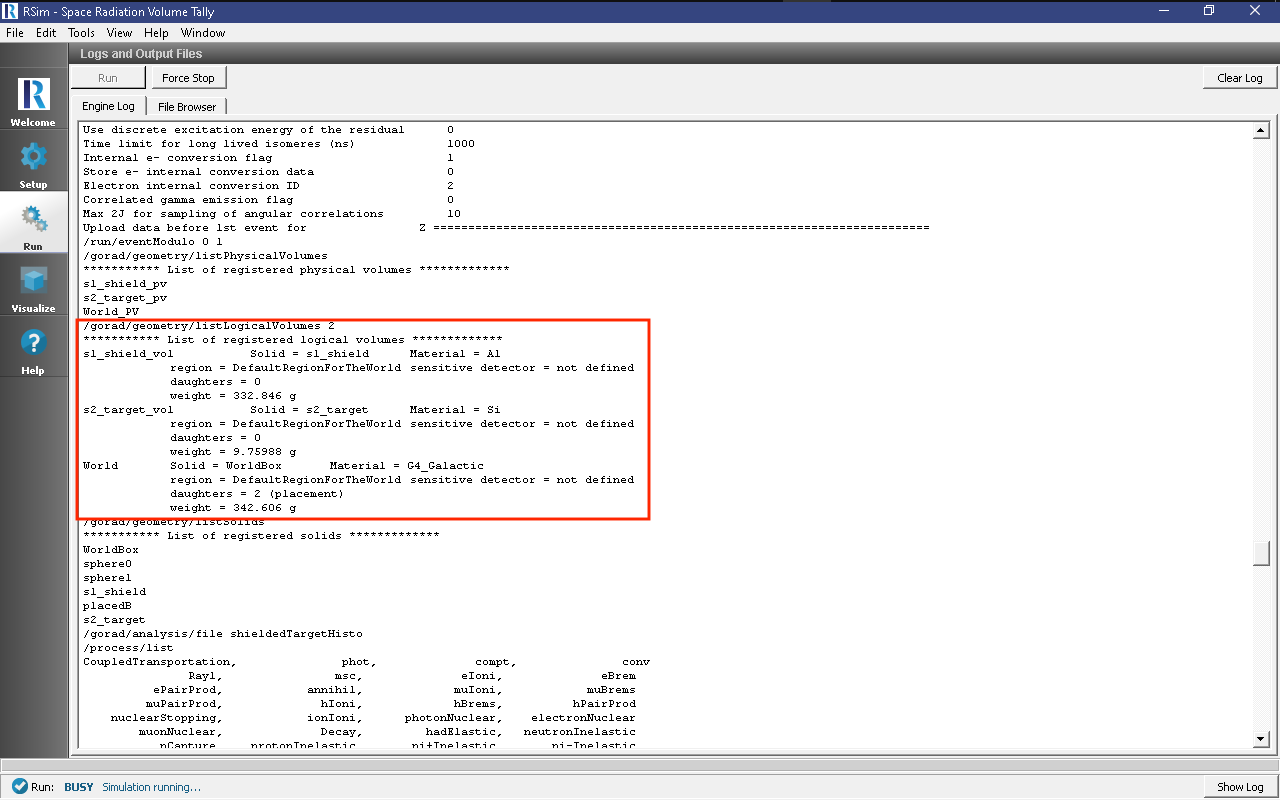
In order to normalize energy deposit to a mass, one can use the information from the run log shown in Fig. 84.
This would allow users to obtain the energy deposit in the target in rad: 1.335e+15/9.75988e-3/6.2415e+10=2.2e+5 rad.
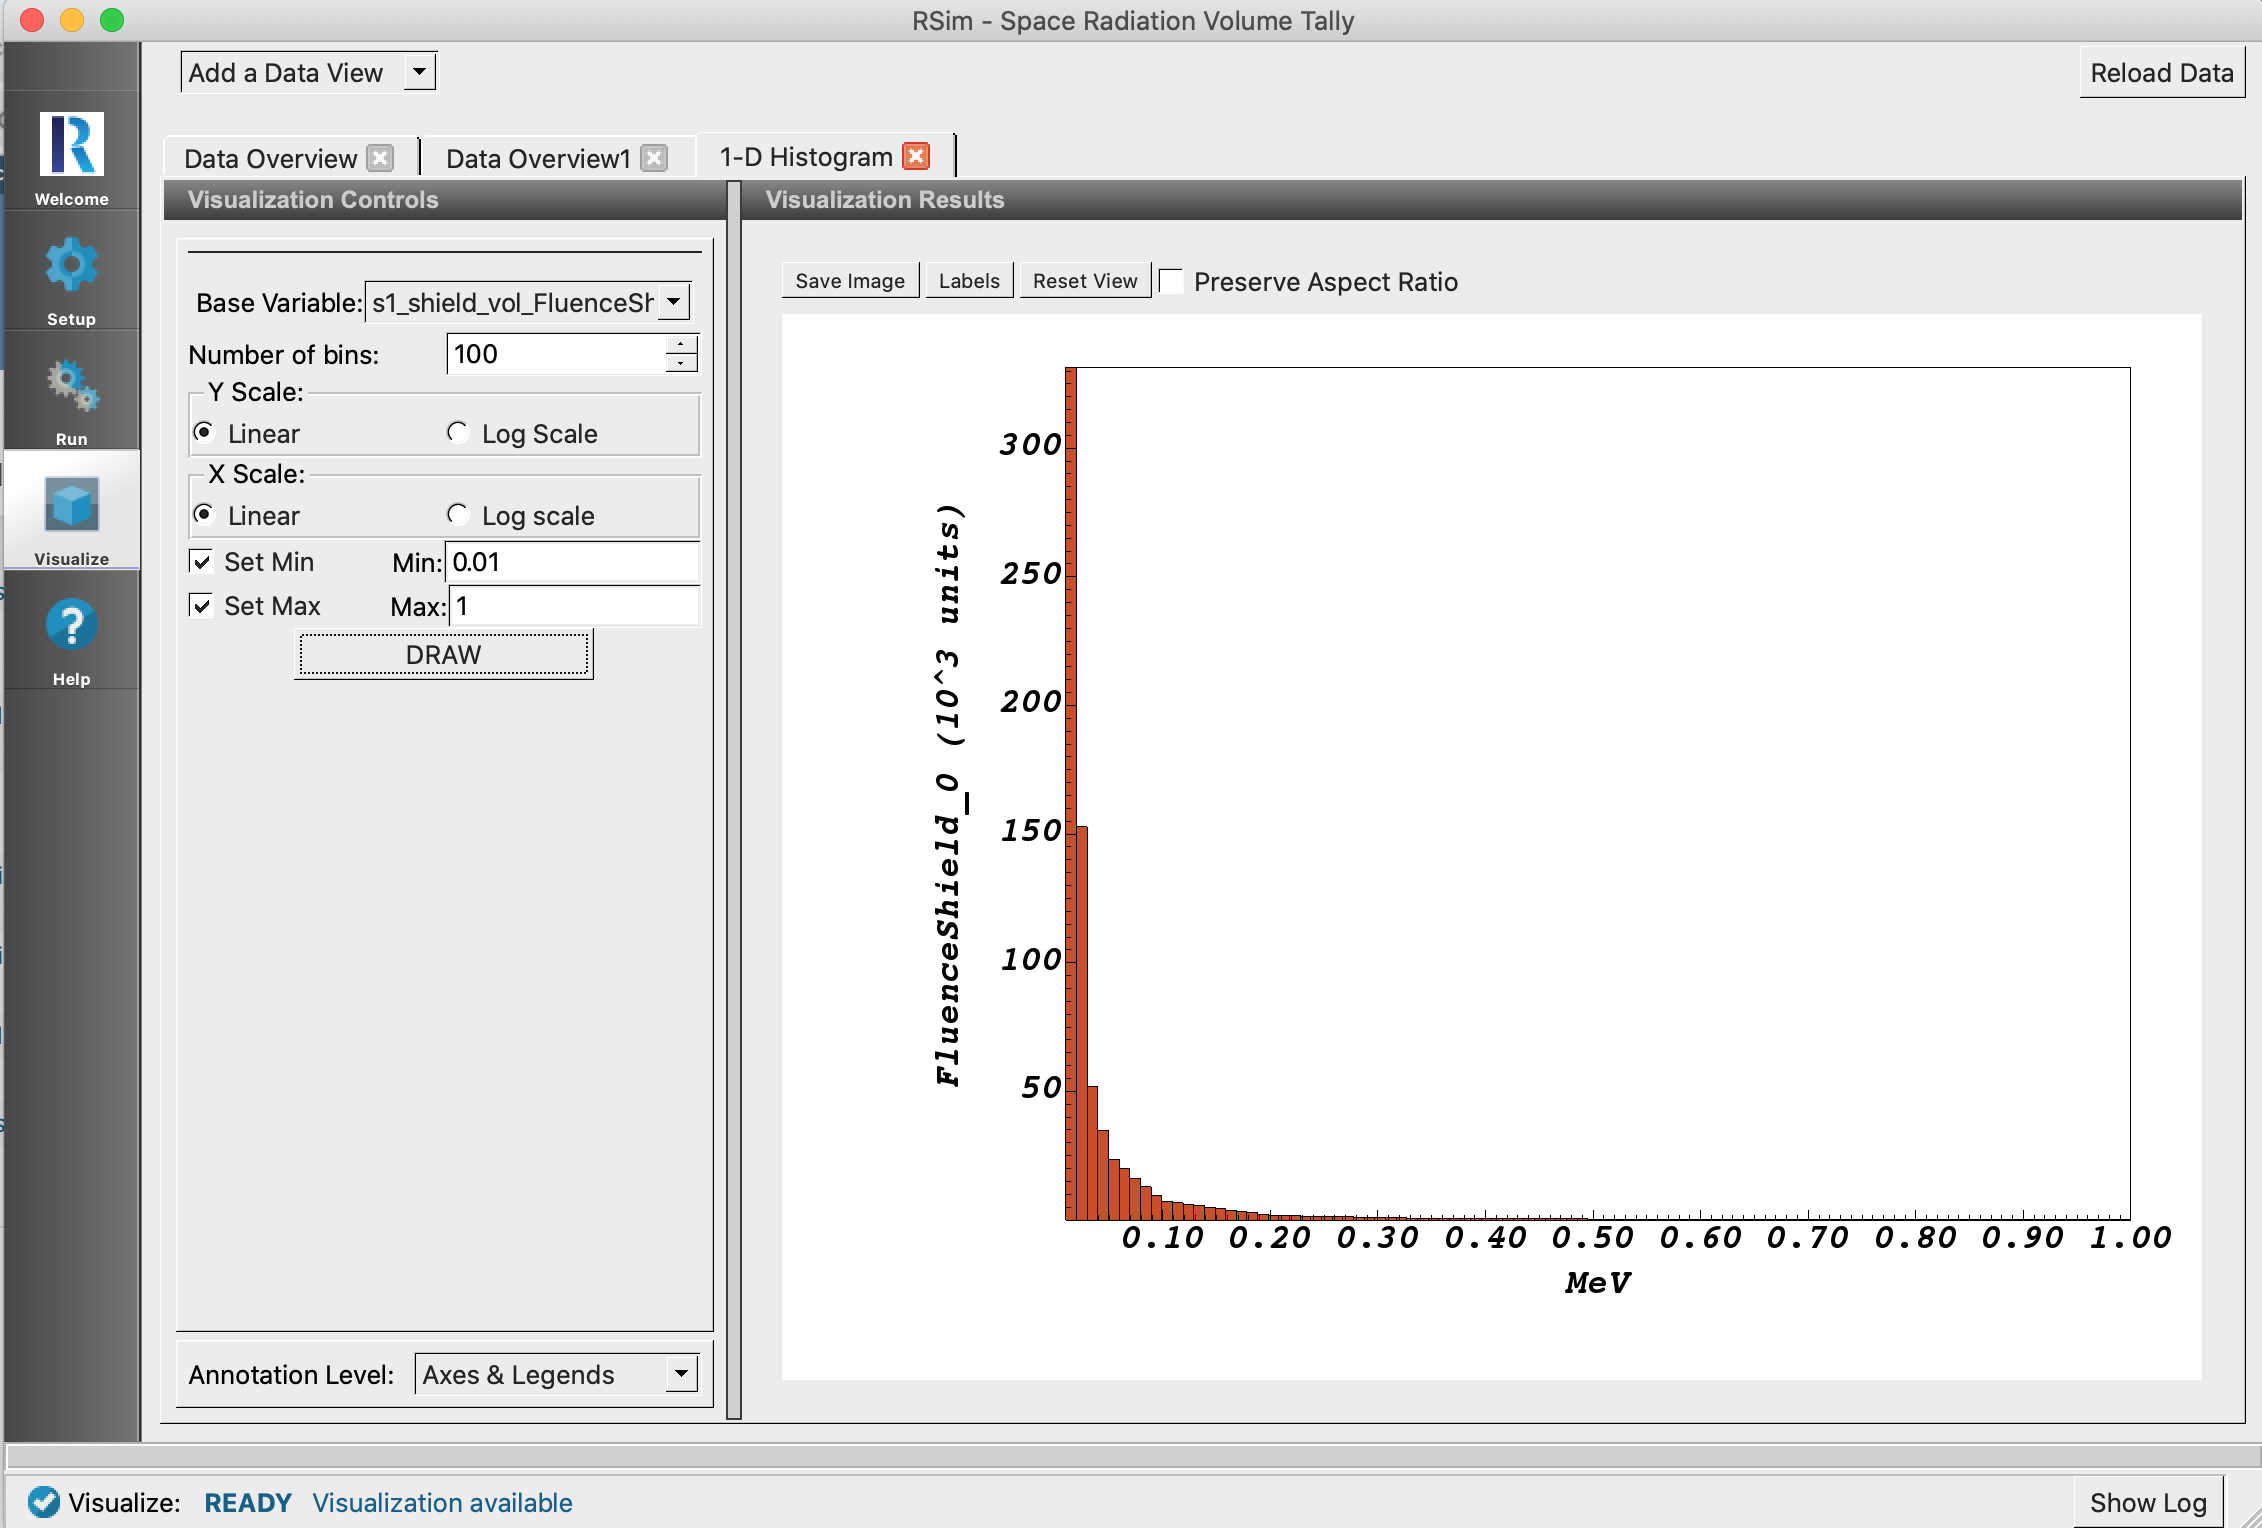
It is also possible to view a histogram of the energy of particles which contributed to the total fluence on the shield
- Click Add a Data View
- Choose 1-D Histogram
- Select the Base Variable s1_shield_vol_FluenceShield
- Click Draw
This shows how the vast majorit of particles are of low energy. This can be compared with the fluence on the target, showing how the shield very effectively shielded it from the low energy particles.
Further Experiments
The dose on the target can be greatly changed by altering the thickness and material of the shield. To do this, switch to the Setup window and change the value of parameter “thickness”.
