Introduction to the Visualize Window
RSim’s Visualization feature is a flexible and comprehensive model viewer based on VisIt. The simulation tutorials and examples in RSim Examples provide several examples of using the Visualization feature’s options in context.
The RSim visualization tool is context sensitive, meaning that only those features that can be used with the current data are made available from the interface.
For more information on VisIt, please see: https://wci.llnl.gov/codes/visit/ and http://www.visitusers.org/index.php?title=VisIt_Wiki
The Visualization window is divided into a Visualization Controls pane on the left and a Visualization Results pane on the right.
Select the Visualize Icon from the Icon Panel
Upon successful completion of the simulation run, the last message in the Engine Log tab is a reminder that you can now select the Visualize icon from the icon panel on the far left of the RSim window as seen in Fig. 39.
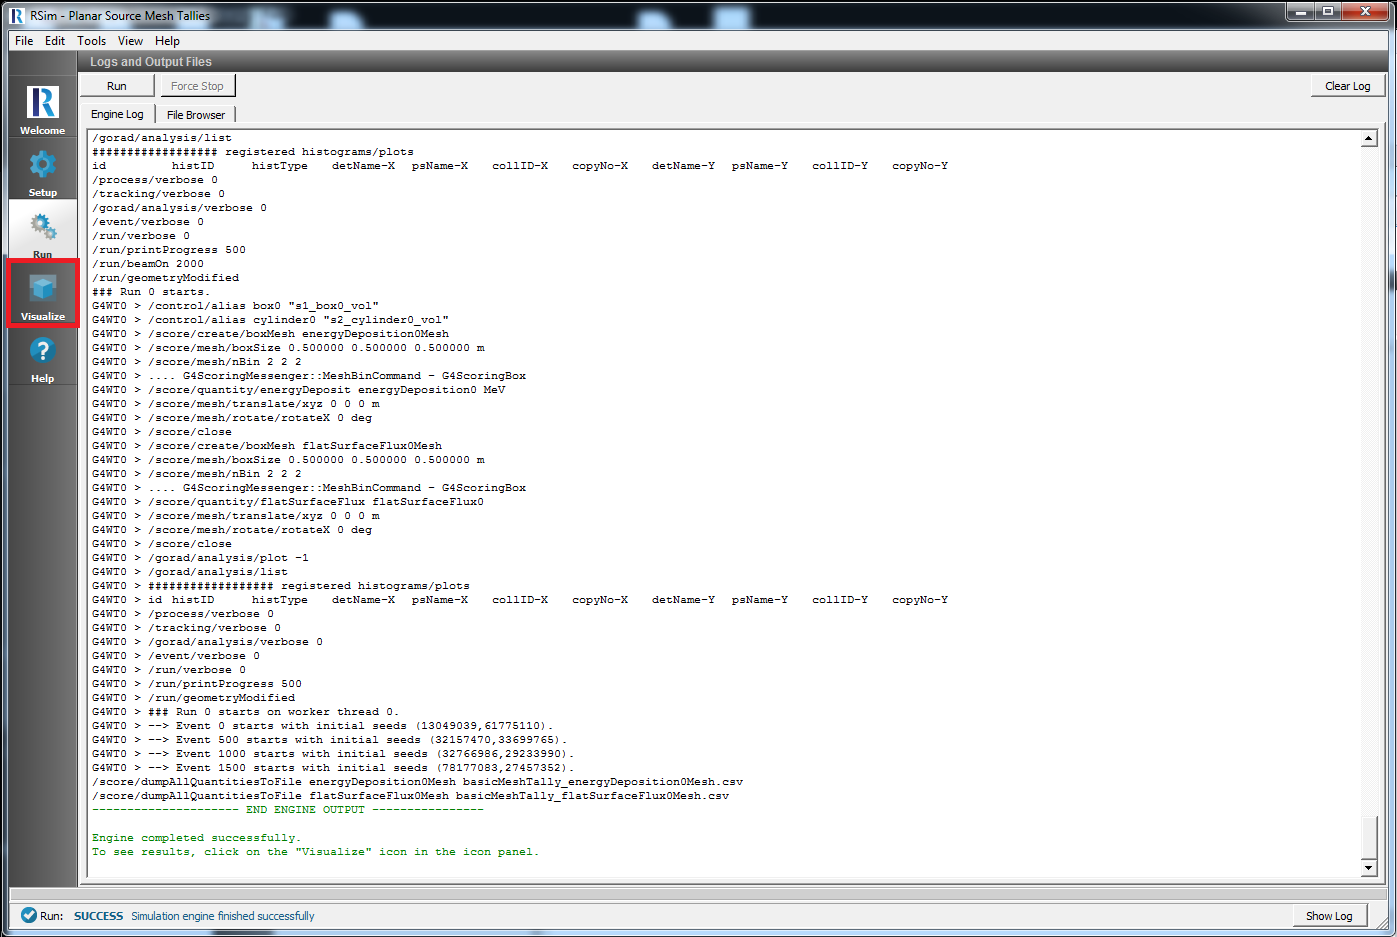
Fig. 39 Visualize Icon in Icon Panel
Standard Controls
Several standaard controls are available.
Annotation Level
To adjust the Annotation Level, use the Annotation Level drop-down menu at the lower left of the Visualization Controls pane.
- No annotations
- Axes only
- Axes & Legends
- All annotations
See Fig. 40.
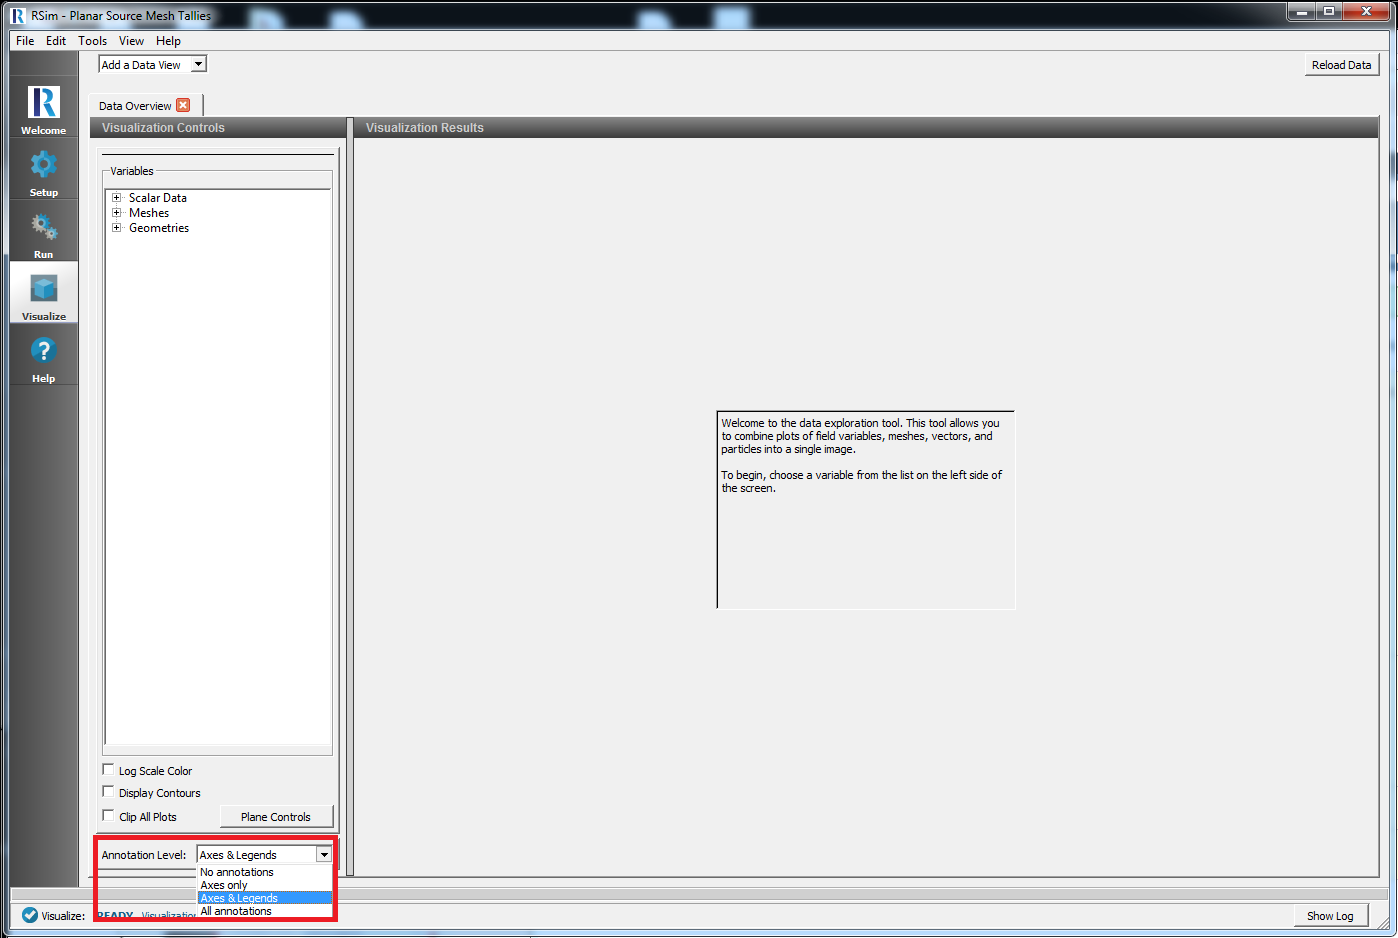
Fig. 40 Annotation Level
Reload Data
The reload data button is used to reload visualization data if some form of post-processing outside of RSim has been performed on the data.
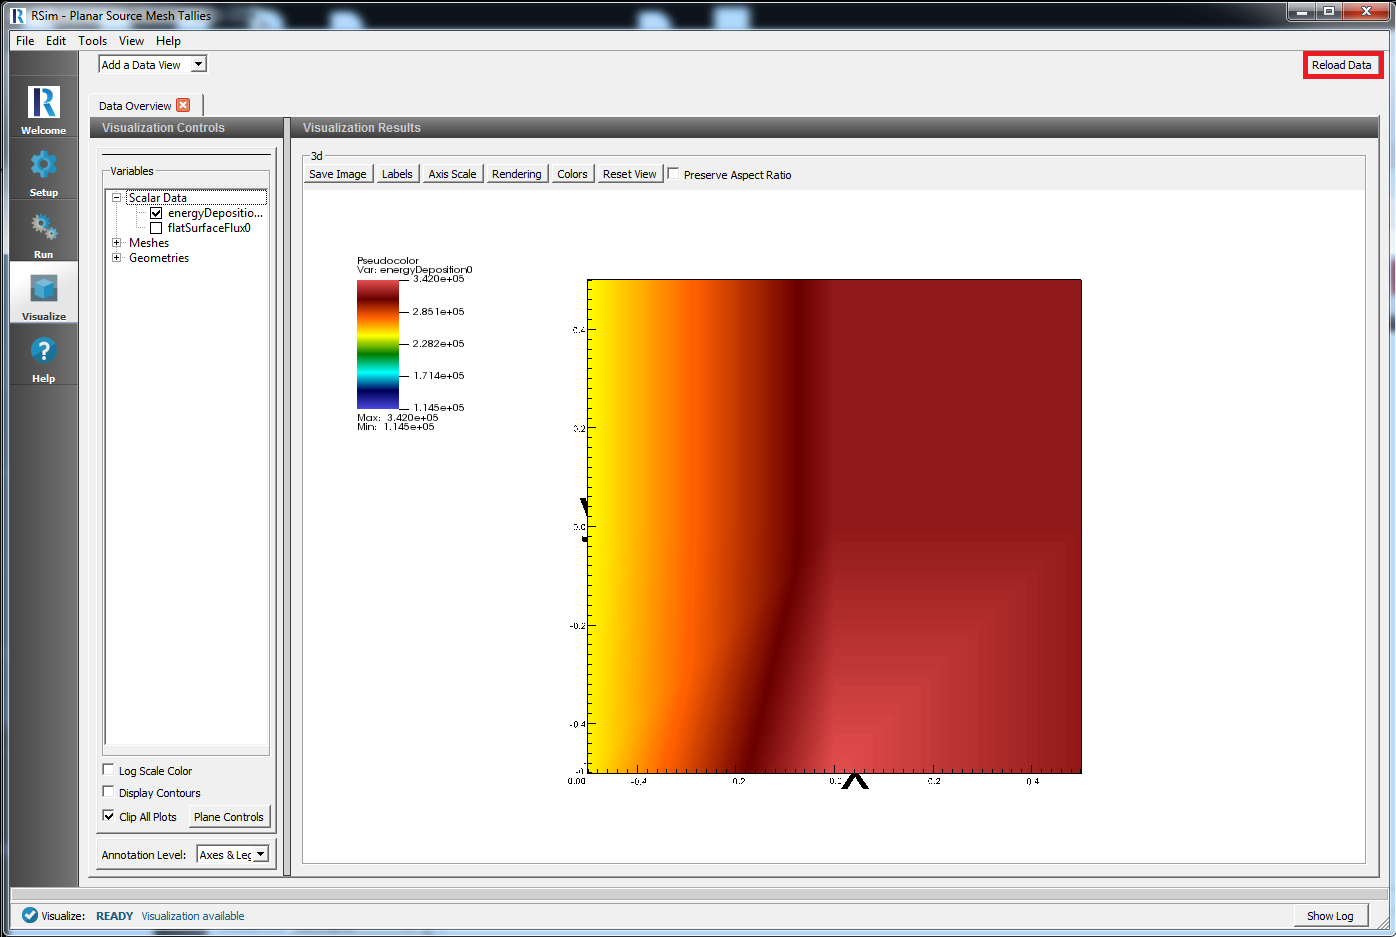
Fig. 41 Controls Pane Buttons
Save Image
This button saves the current image to your computer. You will be given options on where to save, the file name, and format as well as some options on size and dimension.
Labels
This brings up the Axis Labels window. See Fig. 42.
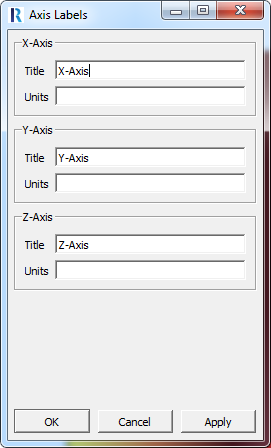
Fig. 42 Axis Labels Menu
Axis Scale
This button enables adjusting the Scaling Factor for each axis. See Fig. 43.
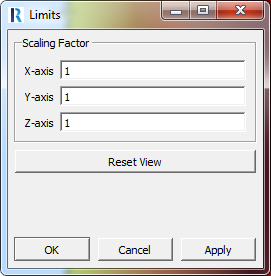
Fig. 43 Axis Scale Menu
Rendering
This button allows for adjustment of the lighting and stereo effects. See Fig. 44.
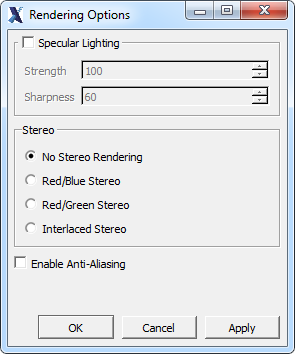
Fig. 44 Rendering Menu
Colors
This button allows changing of the color table used for the plot and allows you to set limits on the minimum and maximum. See Fig. 45.
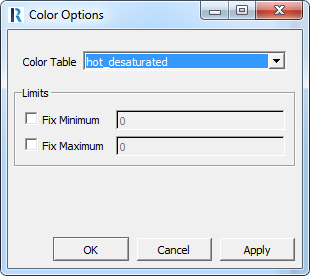
Fig. 45 Colors Menu
When visualizing multiple volume tallies at the same time it is recommended to set the Min value to the minimum tally value and the Max value to the maximum tally value. This will allow for a proper comparison in tally values.
Reset View
This button returns the objects in the Visualization Results pane back to their original location.
Data Overview
All visualizable data from an RSim simulation is available in a Data Overview window. It is possible to have multiple data overview tabs to visualize different parameters from the same simulation. This is done by clicking on the Add a Data View drop down menu and selecting Data Overview.
Variables
The Variables section of the Visualization Controls pane enables you to choose which aspects of the simulation data to visualize. Each RSim simulation will have a Scalar Data, Meshes, and Geometries variable.
Scalar Data
Scalar data consists of all tallies of the simulation. Note that any volume tally will have the same value across the entire volume.
When visualizing multiple volume tallies, it is recommmended to set the Colors explicitly, as detailed in the Colors Button
Meshes
Meshes will show the actual meshes of the mesh tallies in the simulation.
Geometries
All geometries of the simulation will be here, in a wireframe and surface form. The wireframe will have the name of the geometry, while the surface will have the geometryName_surface
Log Scale Color
The Log Scale Color checkbox will be available to enable and disable display of log scale color.
Checking this box will put the color on a log scale. This is useful to see details in a tally. See Fig. 46.
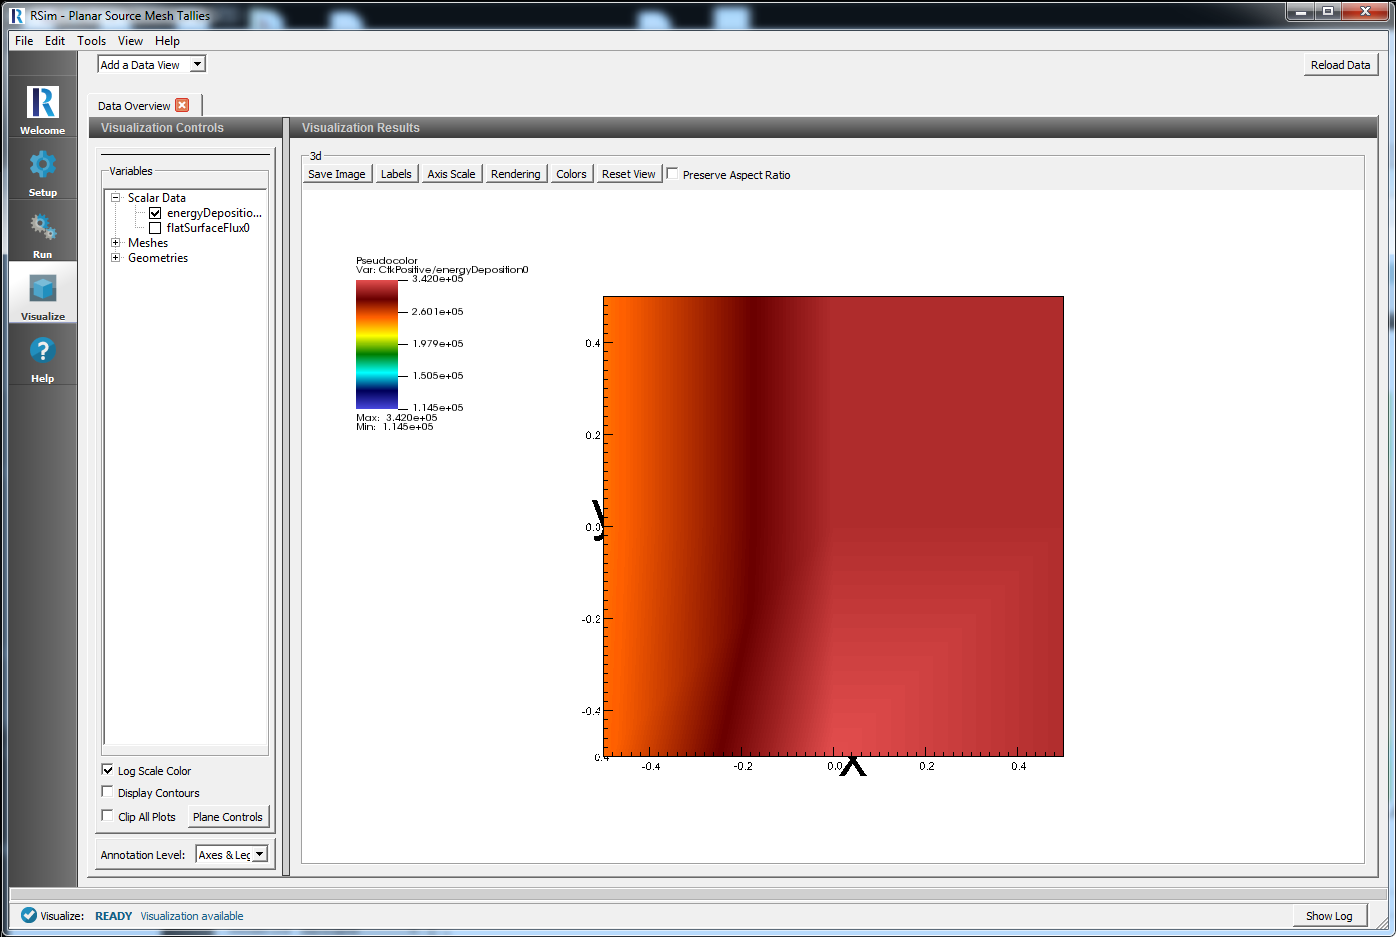
Fig. 46 Log Scale Color Checkbox
Display Contours
The default value in the Contours field is 5. If you select the Display Contours check box and have an appropriate data set selected, the number of contours can be changed to any positive number. See Fig. 47.
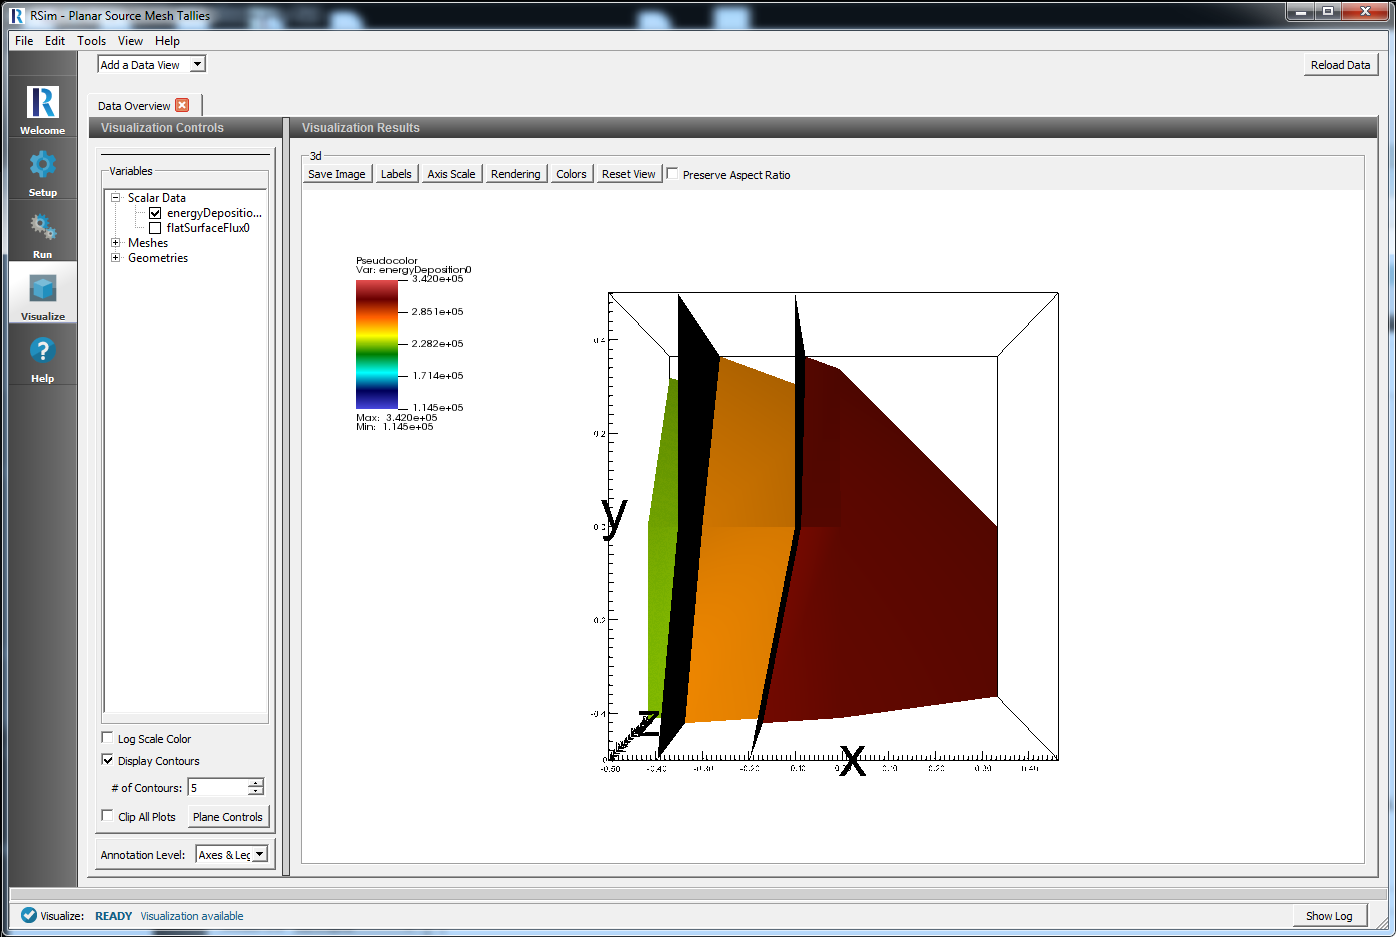
Fig. 47 Contours
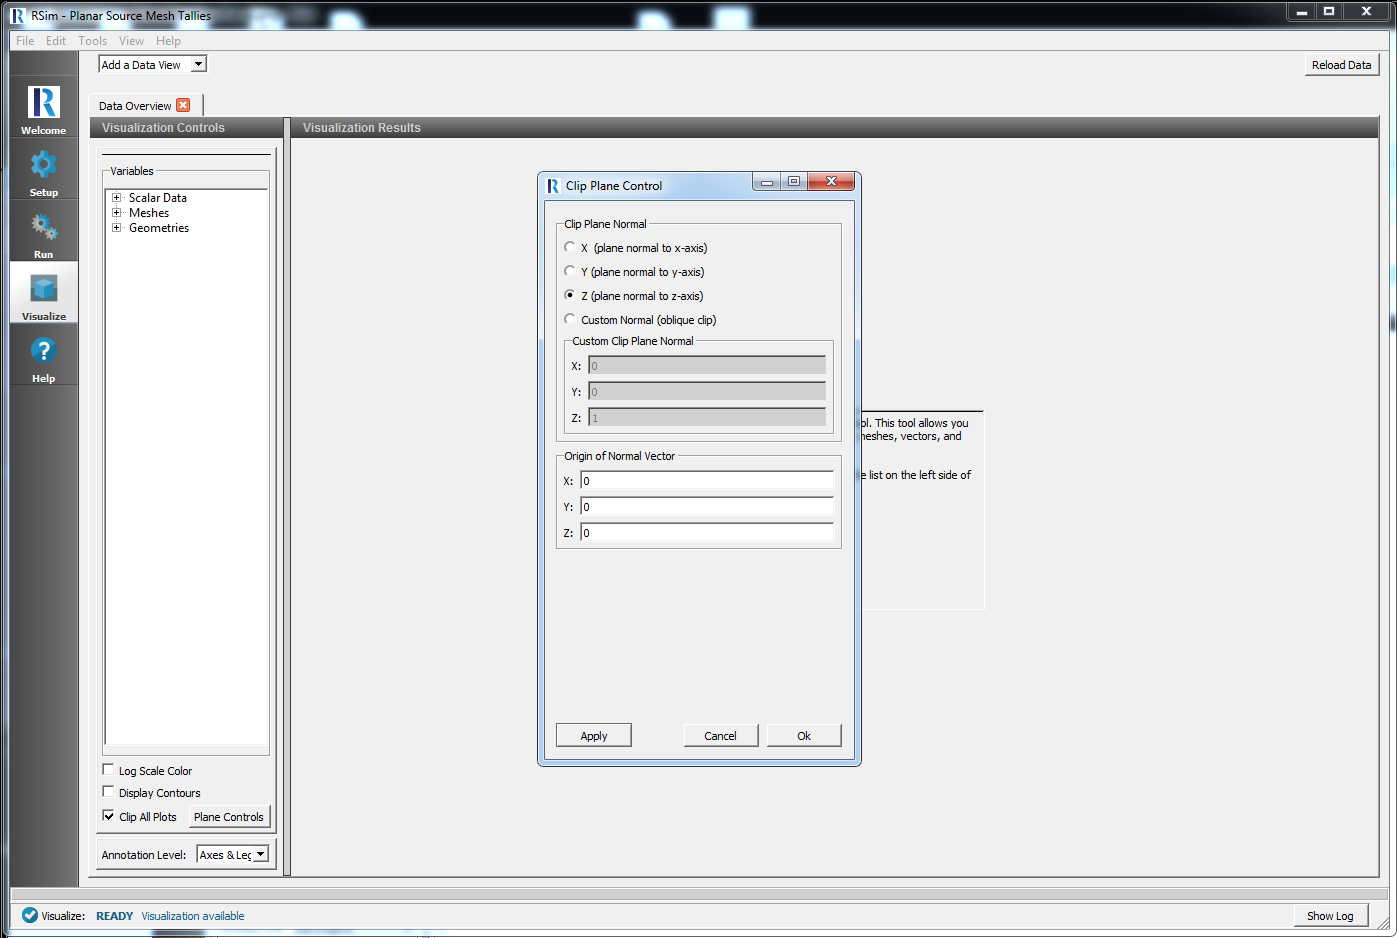
Clip All Plots Checkbox
If the appropriate data is selected, the Clip All Plots checkbox will be available to enable and disable plot clipping.
When Clip All Plots is enabled, the Plane Controls can be used to select an axis intercept or normal vector for the clipping. See Fig. 48.
Mesh Opacity
The opacity of any mesh in the visualization window can be adjusted, sliding the Opacity slider to the left will reduce the opacity, to the right will increase the opacity.