Run Window
Select the Run Icon
Once your validation is successful, in the upper right corner you will see a checkmark by the Save and Setup button. You can now select the Run icon from the icon panel on the far left of the VSimComposer window.
Click on the Run icon as shown in Fig. 78.
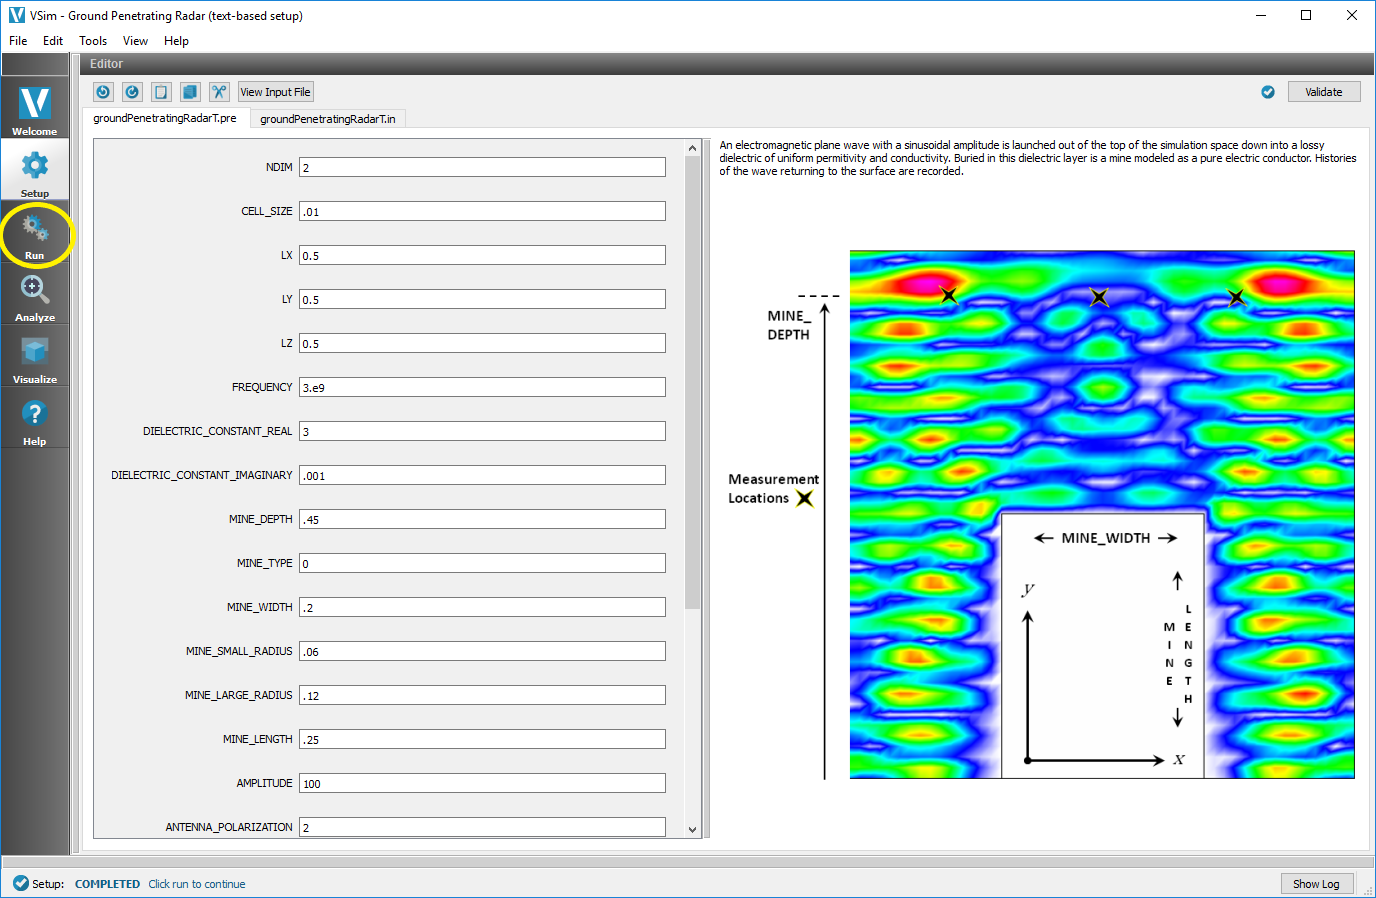
Fig. 78 Run Icon in Icon Panel
The Run Window
The VSimComposer Run window contains two panes. As displayed in Fig. 79, the Runtime Options pane is on the left and the Logs and Output Files pane is on the right, which contains an Engine Log and a File Browser tab.
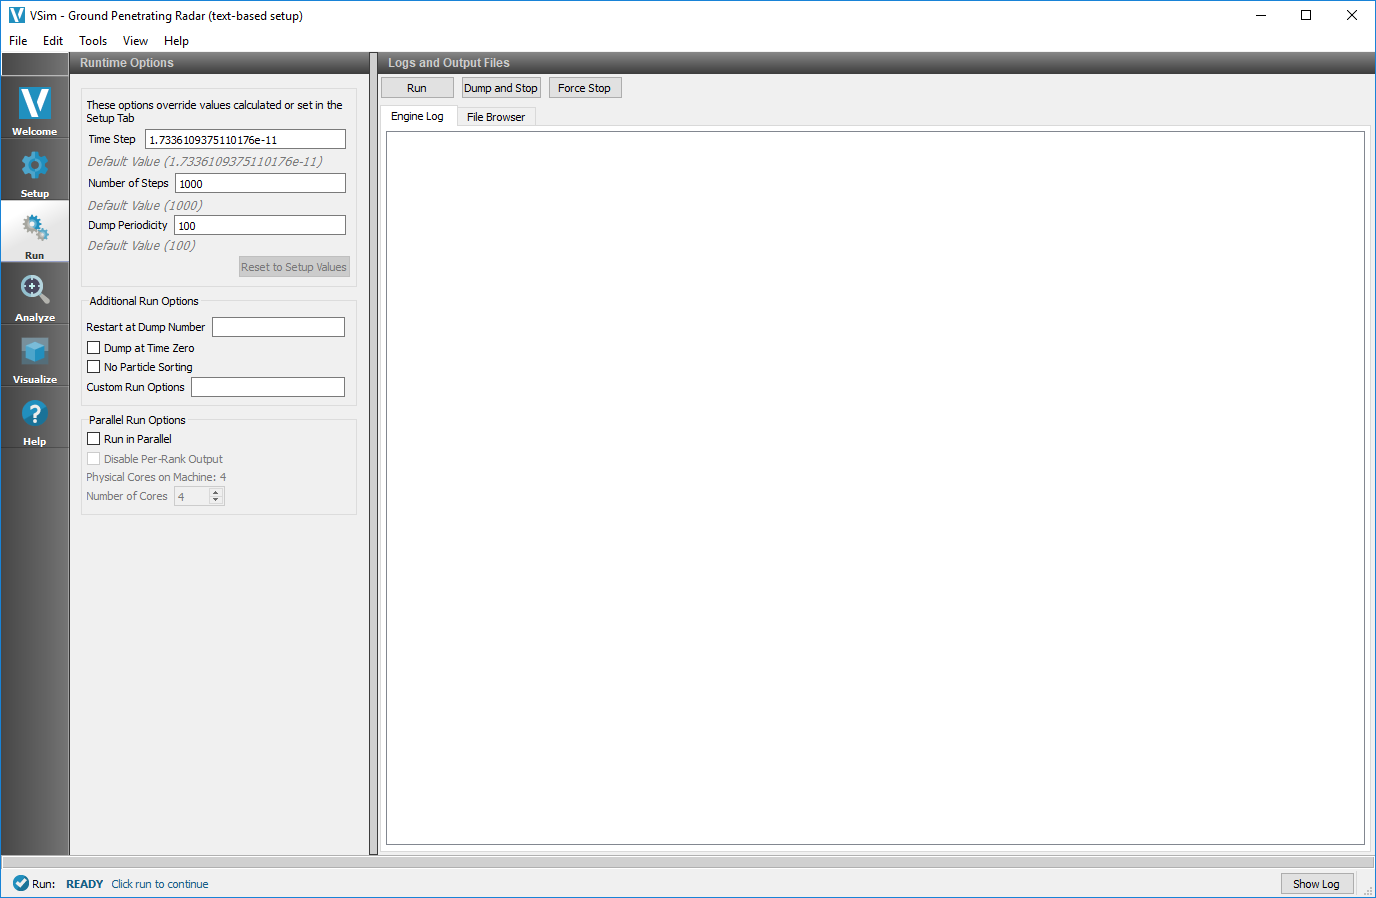
Fig. 79 The Run Window
Runtime Options
VSimComposer enables you to specify runtime options, and in some cases, override the settings in your simulation input file. The Runtime Options pane contains fields and options that give you the flexibility of command line control with the convenience of a graphical interface much like the key input parameters of the setup window.
- Time Step (s):
Step size to use in the simulation. When choosing the step size for your simulation, you must consider stability requirements. For example, for electromagnetic simulations, you should specify a step size that satisfies the Courant condition [CFL28]. You can override the dt variable using the
-dtcommand line option. You must define dt in an input file.- Number of Time Steps:
Number of steps to take. (In the case of a restart, nsteps is the number of additional steps.) This can be overridden with the
-ncommand line parameter. You must define nsteps in an input file or on the command line.- Dump Periodicity (time steps):
How often to dump the data; indicates data is to be dumped whenever the time step has increased by this amount. The command line parameter -d overrides this variable. Must have this defined in an input file or on the command line.
If you make changes to the Runtime Options, you can restore the options to their original settings by clicking on the Reset to Setup Values button located below the Dump Periodicity in the left pane.
Additional Run Options
- Restart at Dump Number:
It is possible in this menu to restart a previous simulation with the Restart at Dump Number field. VSim will load all the data associated with the dump number input in the field, and continue running the simulation from that time.
- Dump at Time Zero:
Dump data at start of simulation, before any time has passed. This option is useful for debugging purposes. It lets you see whether Vorpal used the data you wanted it to use at the start of the simulation.
- No Particle Sorting:
This passes the -ns flag to Vorpal, which tells Vorpal to not sort the particles. Sorting the particles (does not work with cell species) can affect the performance of your simulation.
- Custom Run Options:
You can pass command line arguments to the Vorpal engine here. The list of options can be found in the Reference Manual under Vorpal Command Line Options.
Parallel Run Options
- Run in Parallel:
You may run your simulation in parallel as multiple processes by checking this box. Then, select the number of cores you want to run on. You cannot run on more cores than you are licensed for. The contents of the Engine Log are dumped into separate comms files when you run in parallel. You can check the Disable Per-Rank Output box if you don’t need these files. Additional information on running in parallel can be found below in Running in Parallel from VSimComposer.
Run the Simulation
For our example, we’ll run this simulation using only the default existing settings from the input file.
You do not need to select any file in particular in the File Browser tab before clicking on the Run button. However, if the File Browser tab display area is too narrow for you to see the full file names in the filename list and you would like to see the file name extensions of the files in the file browser, you can adjust the width of the filename field by using your mouse to drag the column border.
Click on the Run button at the top of the Logs and Output Files pane as shown in Fig. 80.
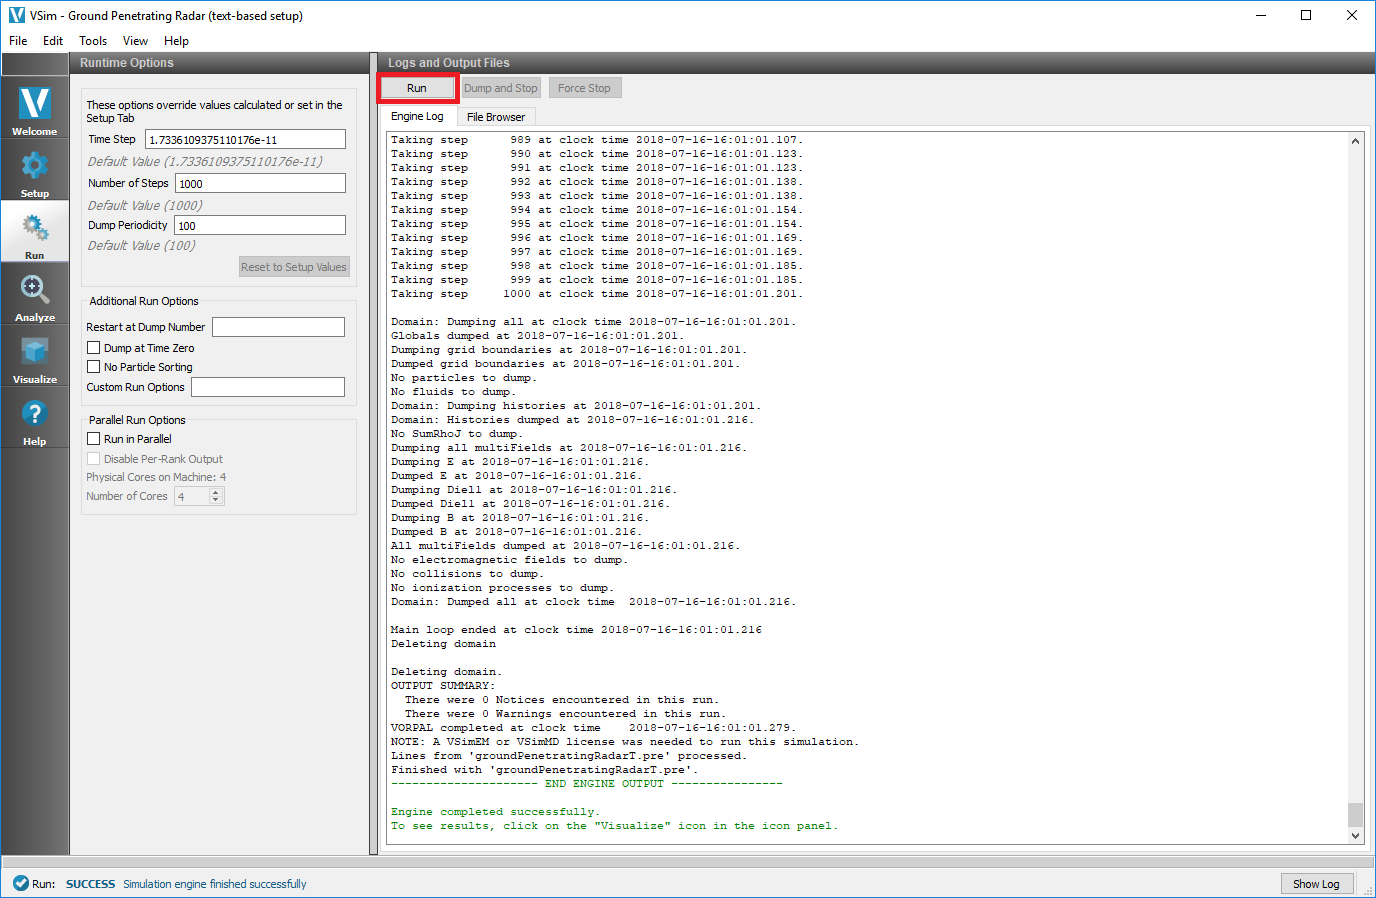
Fig. 80 Run Button
Stopping the Simulation
VSimComposer features the ability to Dump and Stop and Force Stop a simulation. The buttons for these actions are located next to the Run button. The two actions have slightly different uses. The Dump and Stop button is to halt a simulation that is running normally to free up the processors used for another task, or so that one may vary the parameters and restart. When a simulation is stopped it will dump all field and history data, so that it may be restarted from the same point later. The output of a successfully stopped simulation is shown in Fig. 81.
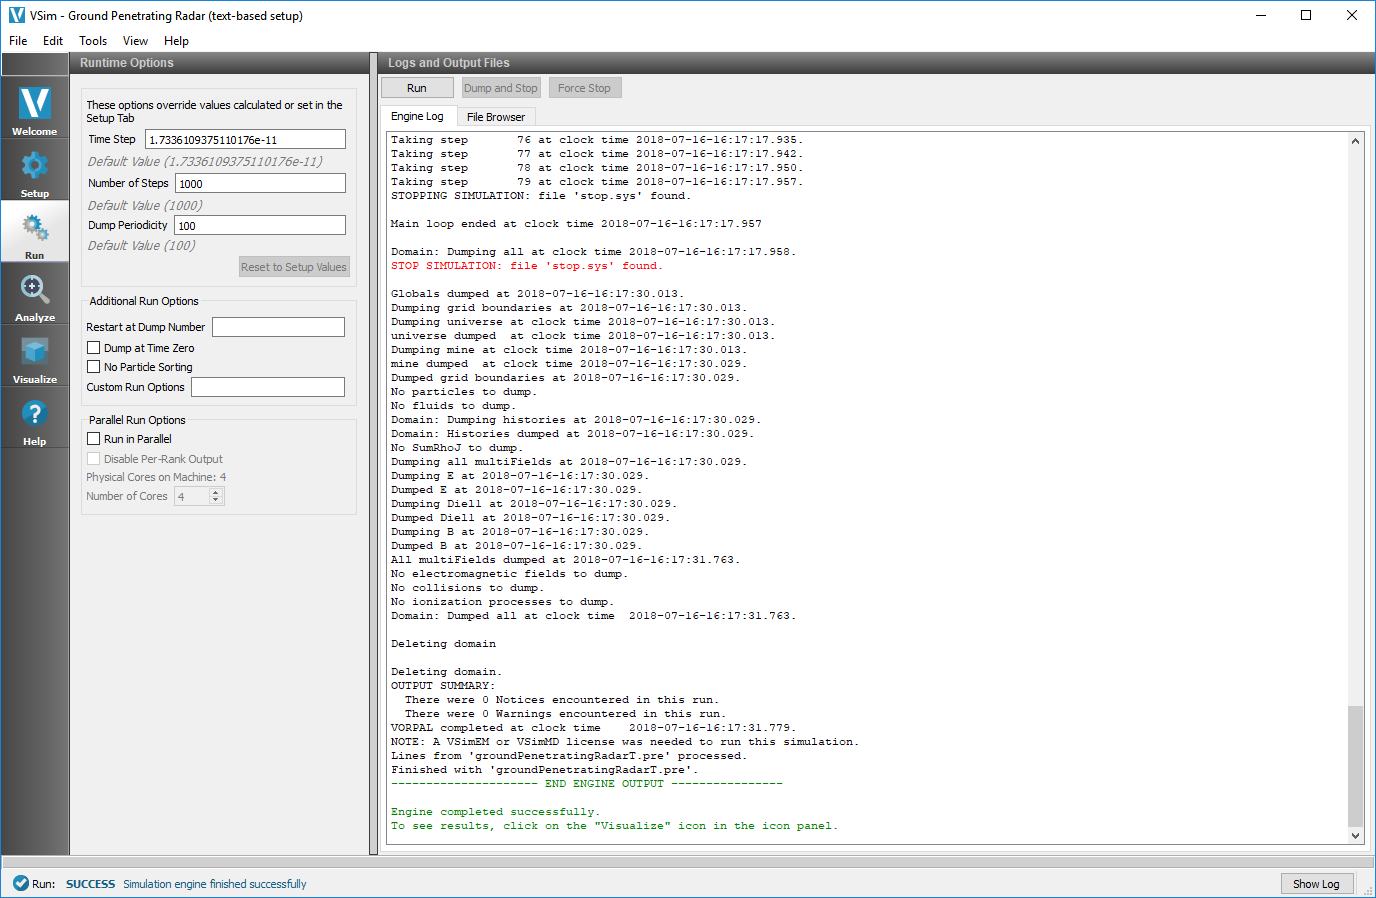
Fig. 81 Stopped Simulation
The Force Stop is to be used if you realize that an error was made in the input file after clicking Run and needs to be corrected. If Force Stop is used the field and history data will NOT be written to a .h5 file before the simulation stops, but it will stop the simulation immediately rather than exiting gracefully. This option is particularly useful when you may have more mesh cells than you intended, where the simulation is trying to allocate more memory than you intended. The output of a successfully force stopped simulation is given below.
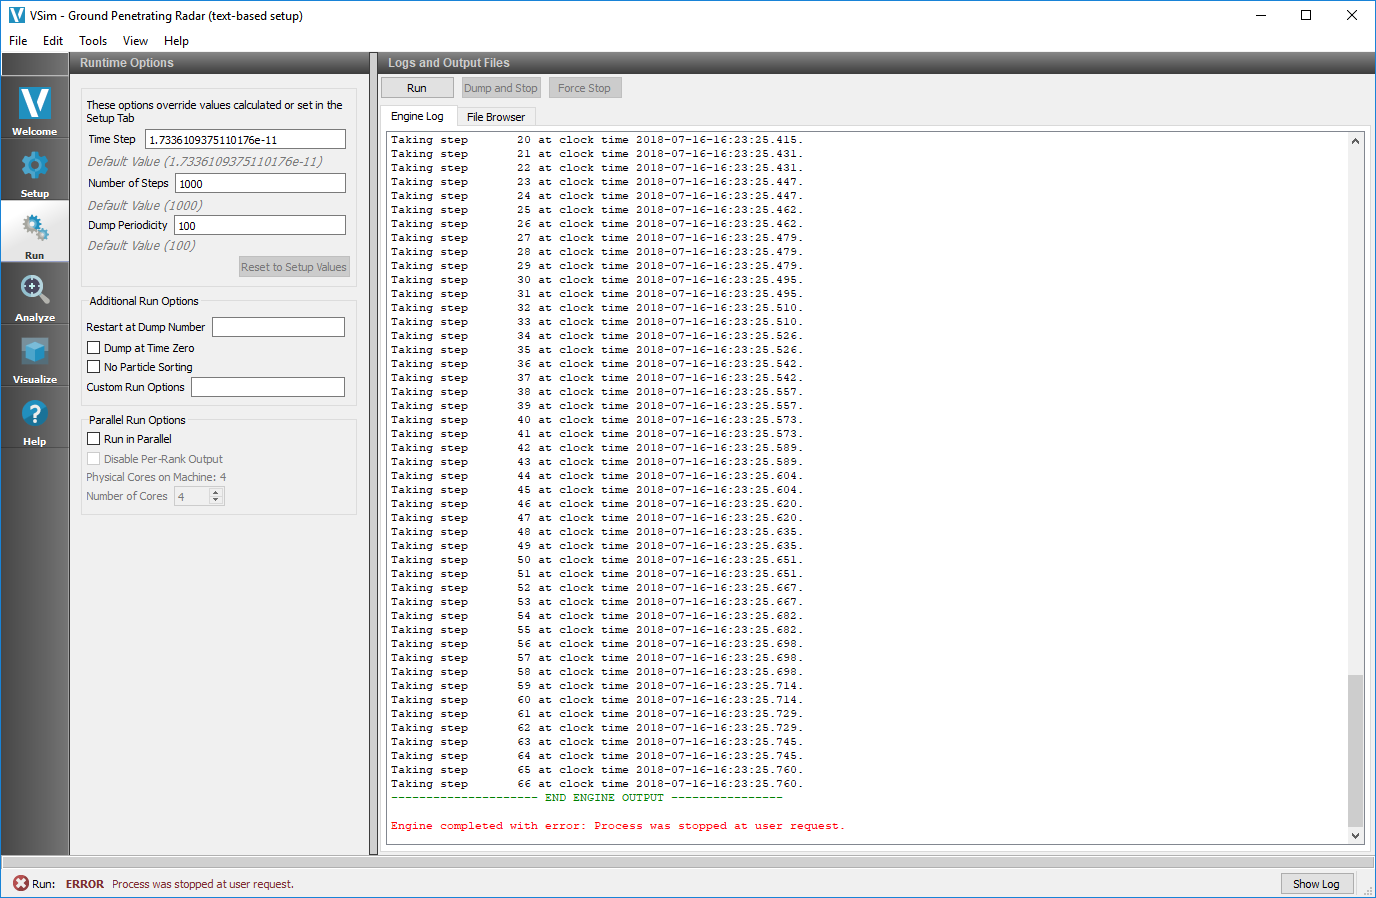
Fig. 82 Force Stopped Simulation
Restarting a Simulation
With VSimComposer it is possible to restart a simulation that has previously been run. This is useful if it is desired to add more time steps to the initial simulation, or if the simulation had been stopped in the middle of the run. Underneath the Runtime Options pane of the run window, under Additional Run Options, there is a Restart at Dump Number field.
Simply put in the last memory dump of the simulation and then click on the Run button, like running a normal simulation. This process is demonstrated in Fig. 83.
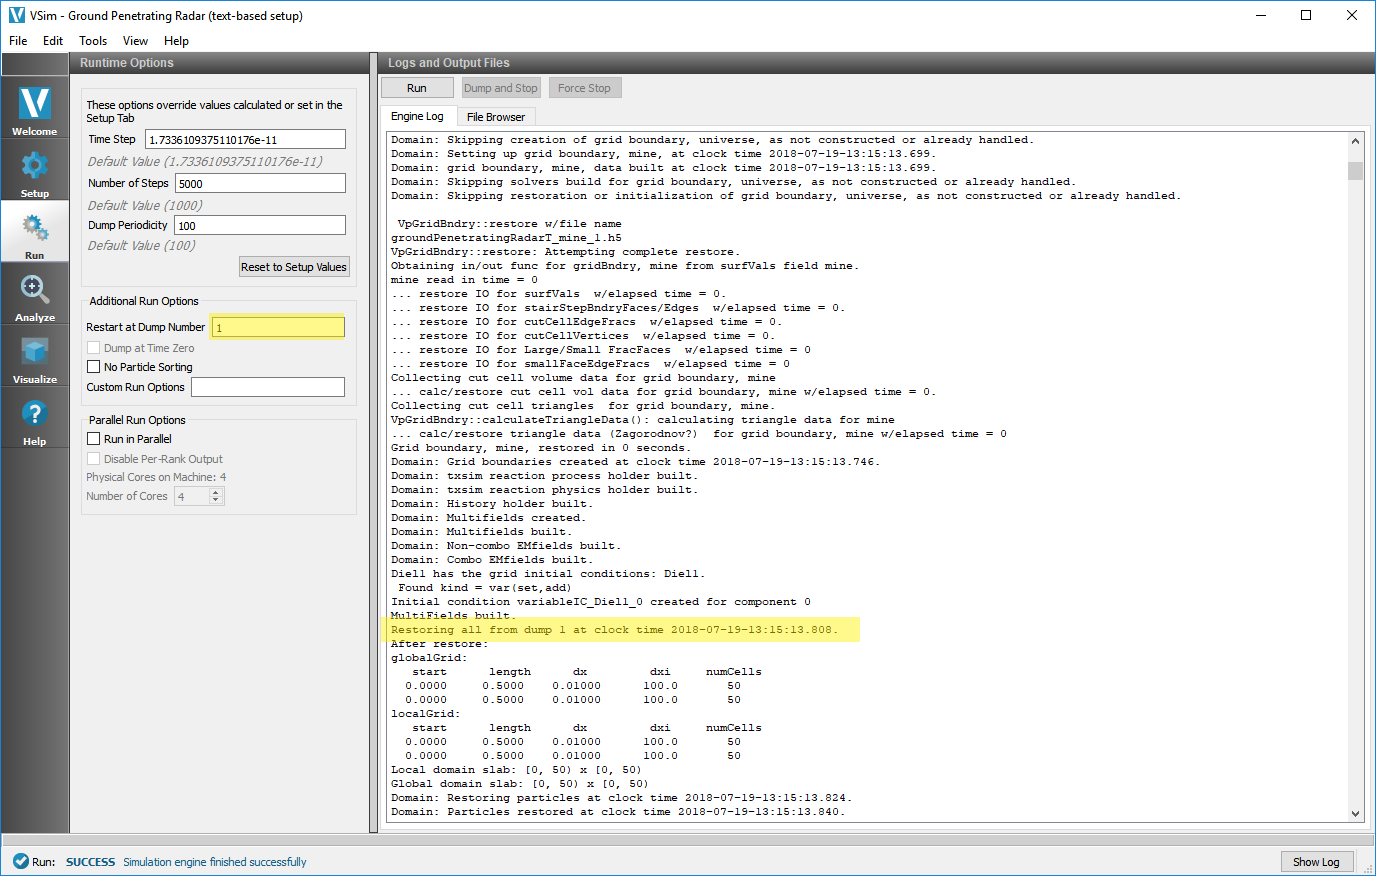
Fig. 83 Restarting a Simulation
View the Engine Log
VSimComposer notifies you of the progress of its activity by reporting results along the way in the Engine Log tab as shown in Fig. 84.
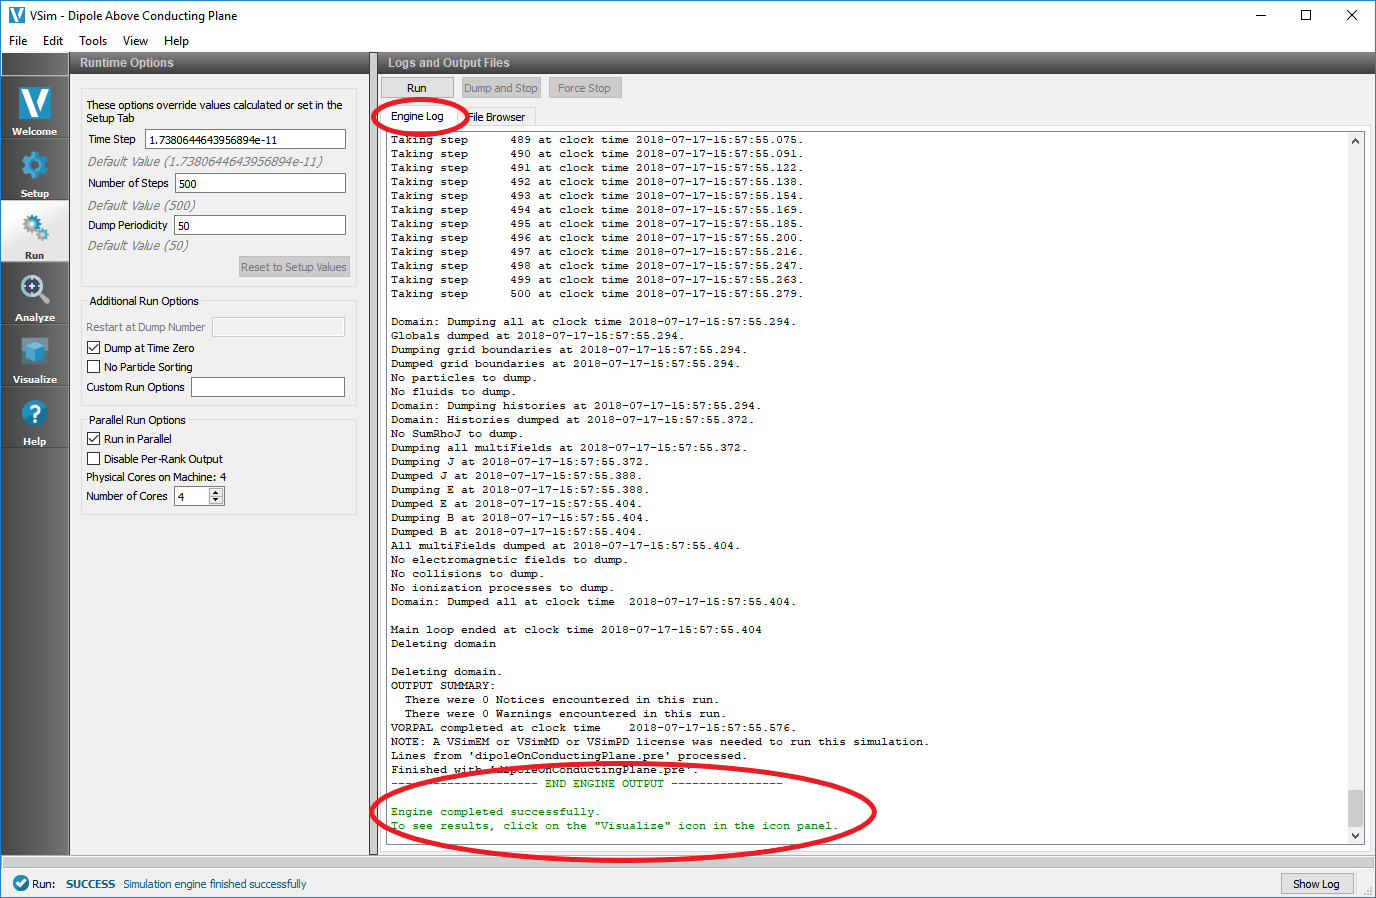
Fig. 84 Engine Log
File Browser Tab in the Logs and Output Files Pane
In previous steps, the File Browser tab was located behind the Engine Log tab in the Logs and Output Files pane. Click on the File Browser tab to bring it to the front as shown in File Browser Tab in Logs and Output Files Pane.
As with the File Browser in the Setup window, the File Browser in the Run window also has the Smart Grouping and All Files pull-down menus at the bottom of the tab.
After a simulation has been run, you will be able to see the files that were output based on your number of time steps and the dump periodicity. See Fig. 85.
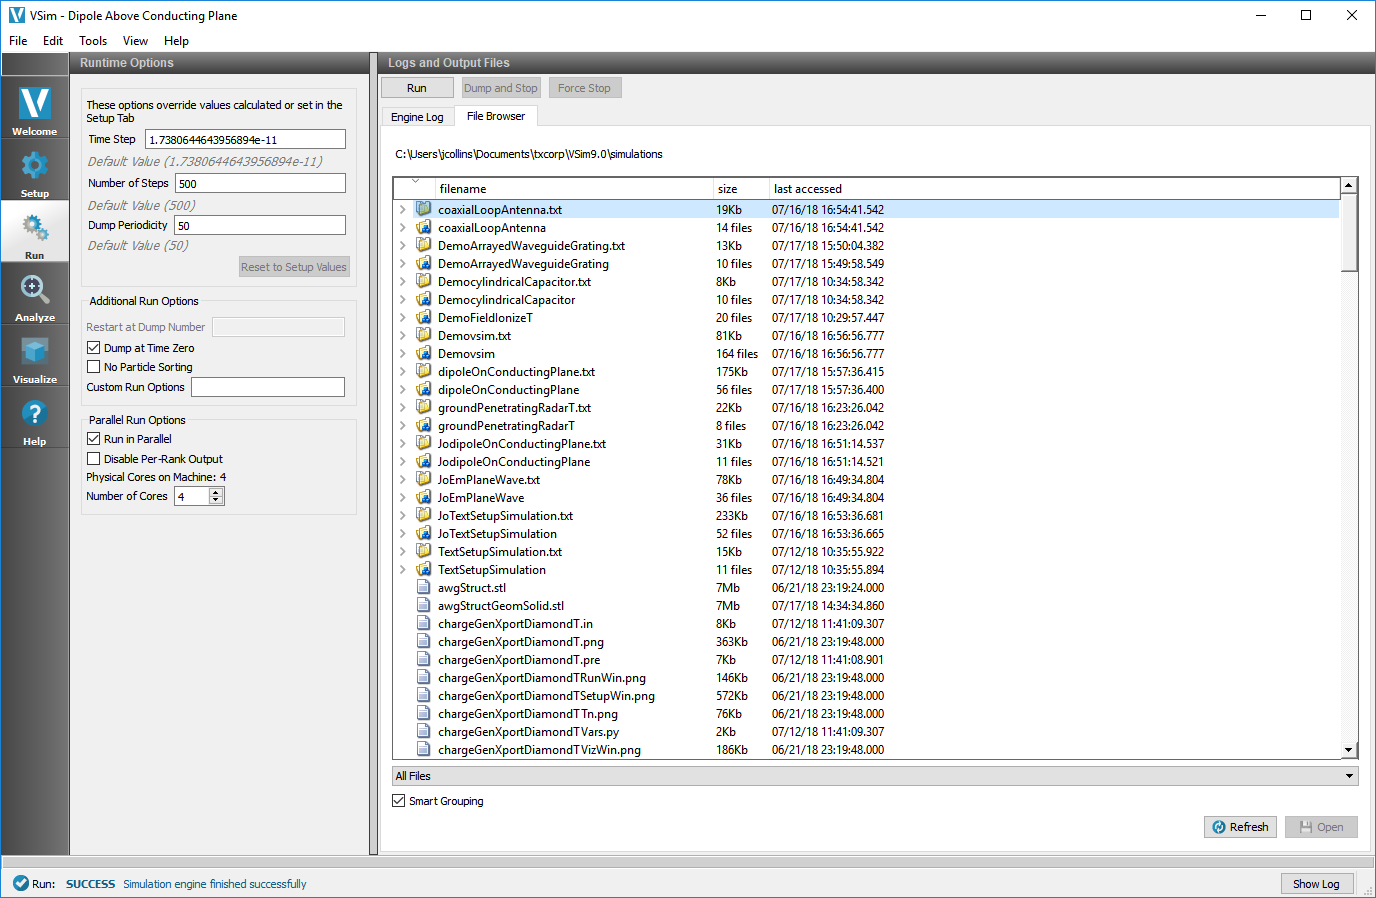
Fig. 85 File Browser Tab in Logs and Output Files Pane
Output File Naming Conventions
The first part of the output file name is the name of the input file. This is often referred to as the base name.
The second part of the output file name indicates the file’s contents, for example:
The name of the field or particle species, such as E, B, or electrons.
Globals for the file containing global variables such as the global grid, needed for restarts.
History, containing data recorded over time.
comms and “all” text files, containing various debugging and information about the simulation.
The third part of the output file name is the dump number.
The final part of the output file name is the suffix.