Laser Plasma Accelerator (laserPlasmaAccel.sdf)
Keywords:
- Laser Plasma Accelerator
Problem description
This example demonstrates the use of VSim to simulate a simple laser-plasma accelerator problem using the full PIC algorithm.
An intense, short laser pulse propagating through a plasma can lead to the separation of electrons and ions capable of producing accelerating electric fields of hundreds of GV/m [GTVT+04]. VSim is capable of simulating laser plasma accelerators (laserPlasmaAccel) using several different models: envelope, fluid and full particle-in-cell (PIC).
Here we look at the full PIC model with a 1-mm long plasma with uniform density of \(1.e25 \mbox{ m}^{-3}\). A gaussian laser pulse, defined by the transverse electric field
where \(w_0\) is the radius at which the wave amplitude drops to \(1/e\), \(T\) is the temporal duration of the pulse,
are the squares of amplitude reductions from being the launching at a distance, \(F\), from the focus, \(Z\) is the Rayleigh length, and
are the Gouy phases.
The laser is launched from the left side of the box. The laser amplitude is determined through the normalized vector potential \(A_0 = e E_0/\omega m_e c\), where \(\omega\) is the laser angular frequency.
The simulation setup consists of an electromagnetic solver using the Yee algorithm. The laser pulse is launched from the left side of the window using the pre-defined gaussian pulse launcher at the left boundary. Simple conducting boundary conditions are used at the top and sides. As such, one must ensure that waves reflected off the top or bottom do not get into the simulation, and that no waves hit the right boundary to be reflected back into the simulation.
The plasma is represented by macro-particles which are moved using the Boris push. The particles are variably weighted to represent the density ramp.
The input file allows one to set up plasma and laser parameters. The simulation box size is determined as a function of the laser length and spot size. The resolution was set to have about 24 cells per wavelength longitudinally and 3 transversely. The time step is chosen to be very close to the Courant condition limit in order to have good dispersion.
This simulation can be performed with a VSimPA license.
Opening the Simulation
The Laser Plasma Accelerator example is accessed from within VSimComposer by the following actions:
Select the New → From Example… menu item in the File menu.
In the resulting Examples window expand the VSim for Plasma Acceleration option.
Expand the Introductory Examples option.
Select “Laser Plasma Acceleration” and press the Choose button.
In the resulting dialog, create a New Folder if desired, and press the Save button to create a copy of this example.
All of the properties and values that create the
simulation are now available in the Setup Window as shown in
Fig. 486. You can expand the tree
elements and navigate through the various properties, making
any changes you desire. The right pane shows a 3D view of the
geometry, if any, as well as the grid, if actively shown. To
show or hide the grid, expand the Grid element and select or
deselect the box next to Grid.
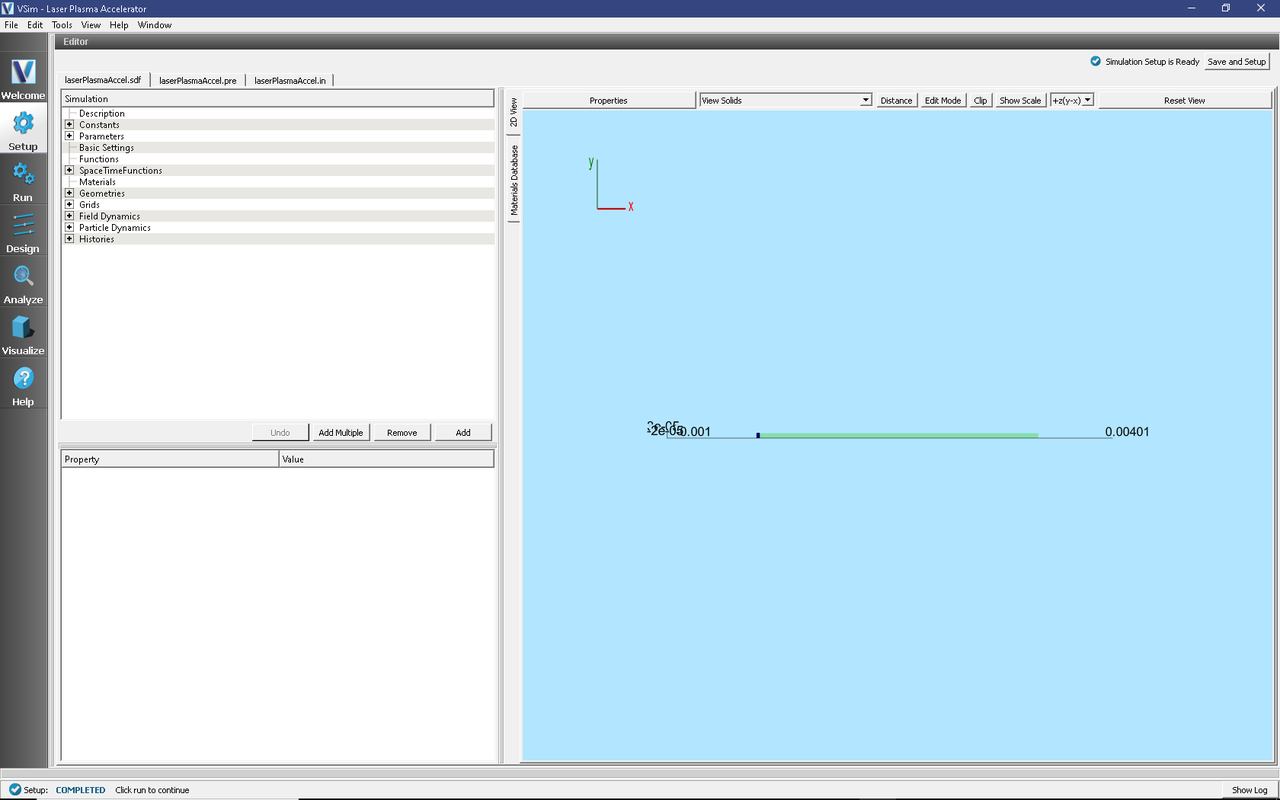
Fig. 486 Setup Window for the Laser Plasma Acceleration example.
The Setup Window shows a very long simulation. However, the full length is not simulated at any one time. Instead a moving window is used to simulate only the region where dynamics is occurring. The moving window can be seen in Fig. 487 as a small box on the left end of the electron loader.
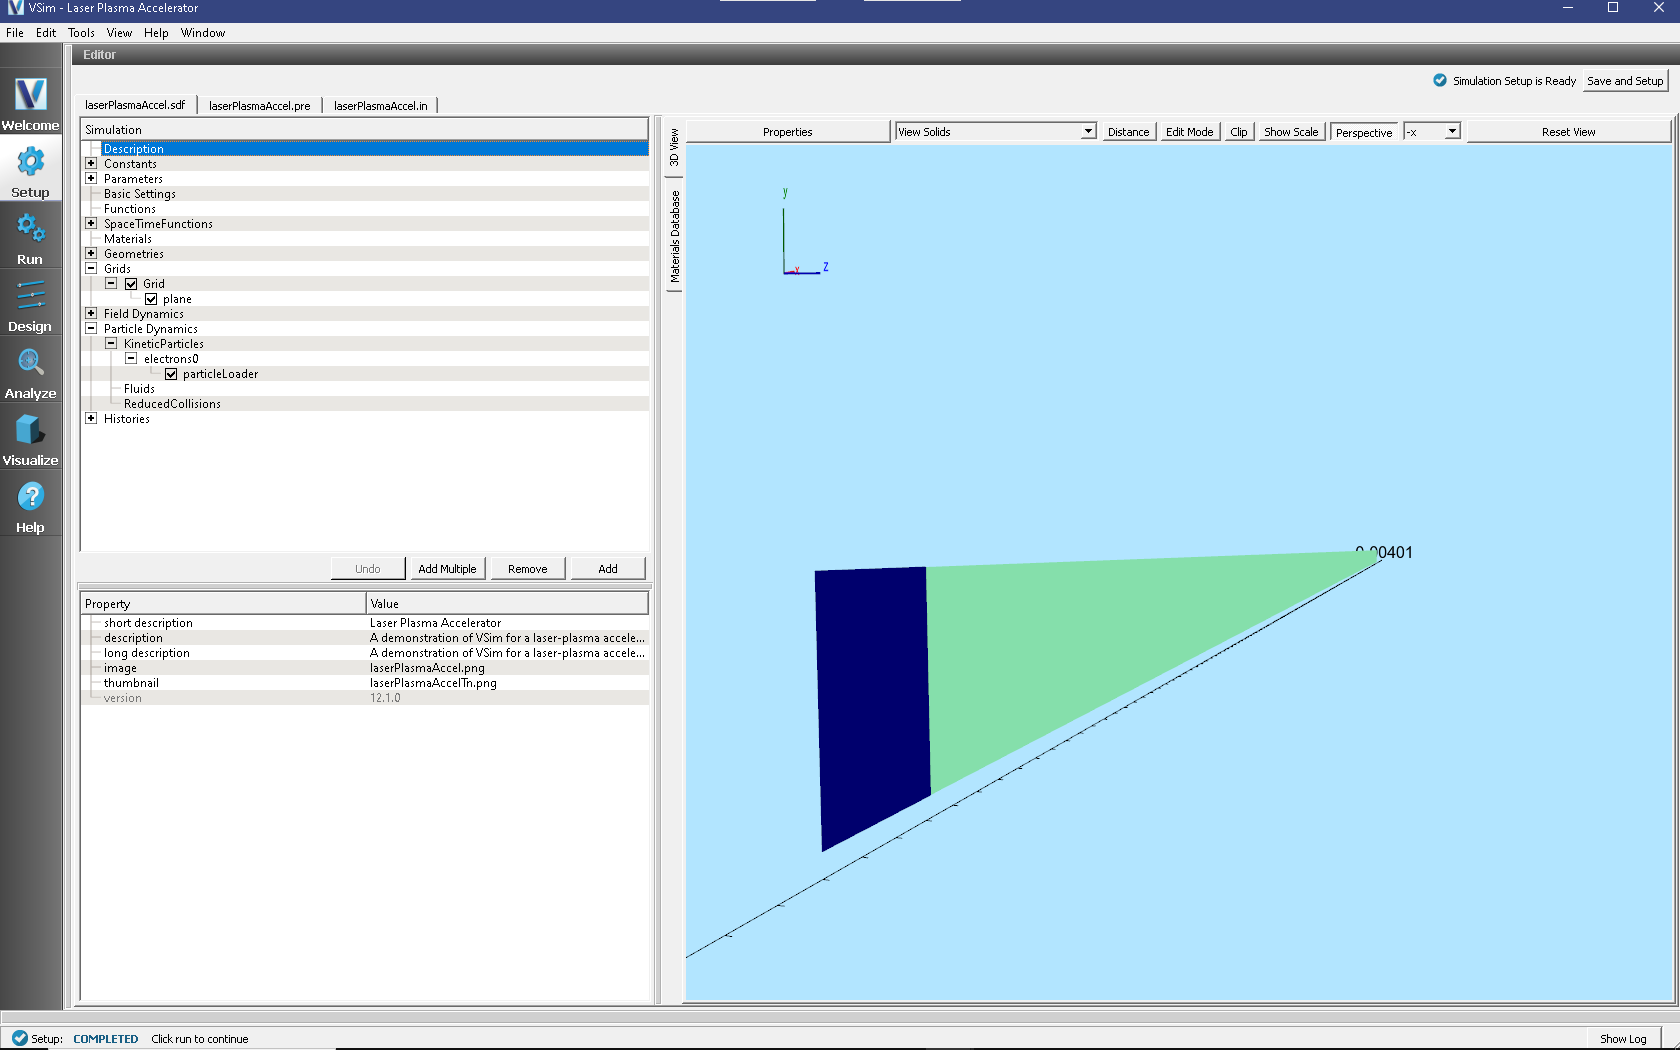
Fig. 487 Setup Window, zoomed in on the moving window, for the Laser Plasma Acceleration example showing size of grid.
To see this view: * First toggle off the axes by clicking the Toggle Axes button, if it is not visible, click the Properties button and then uncheck Toggle Axes.
Then expand the Particle Dynamics → KineticParticles → electrons0 item in the setup tree and click particleLoader. Finally, zoom in and translate to the left to see the left edge of the particle loader and the darker grid. If one wishes to simulate this for longer distances, one can set the Parameter,
NUM_XLENGTHSS, to a larger number; 400 is more than enough.
Running the simulation
After performing the above actions, continue as follows:
Proceed to the Run Window by pressing the Run Tab in the left column of buttons.
To run the file, click on the Run button in the upper left corner of the window. You will see the output of the run in the right pane. The run has completed when you see the output, “Engine completed successfully.” See Fig. 488.
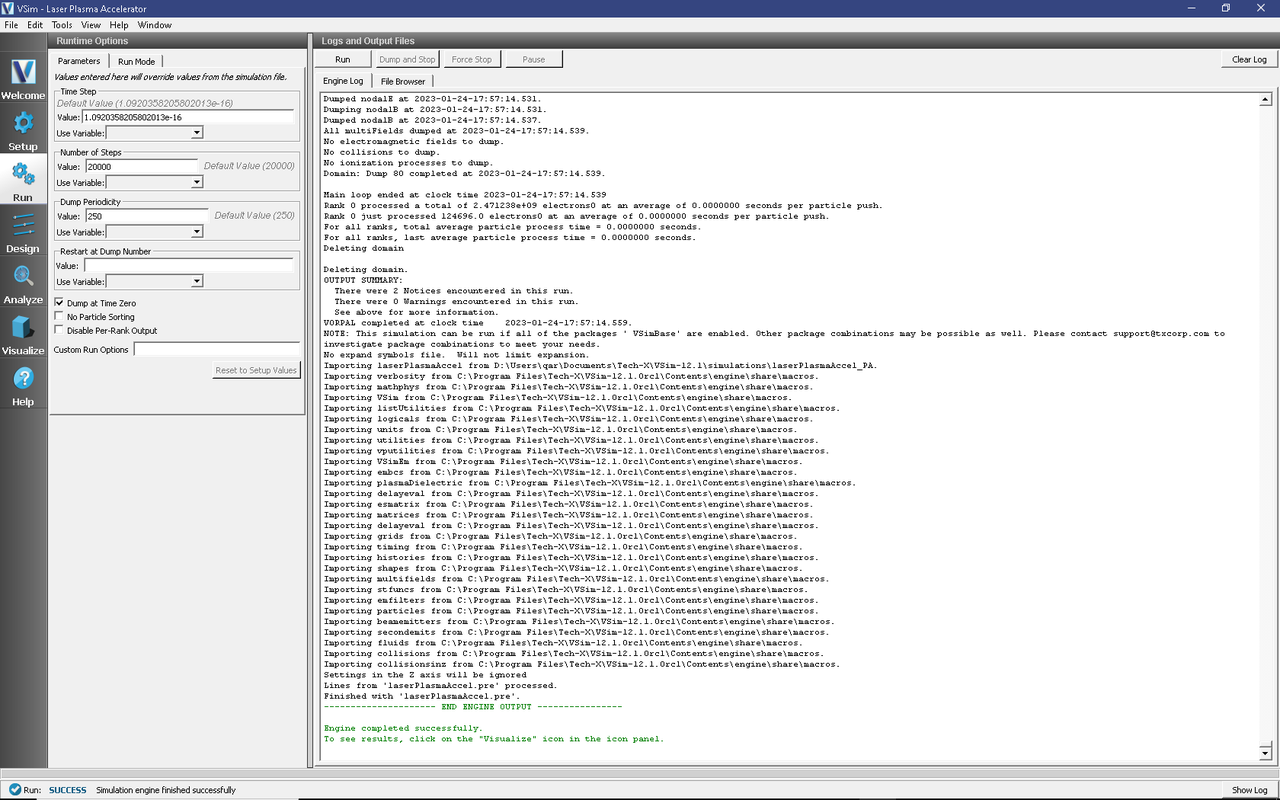
Fig. 488 The Run Window at the end of execution.
Running in 2D, this simulation uses around 225,000 cells and nearly 200,000 particles for 20,000 time steps. The run takes about an hour on a 4-core 2.5 GHz I7.
Visualizing the results
After performing the above actions, click on the Visualize Tab in the column of buttons at the left. For all plots, it is useful to keep Auto Reset on so that the window moves with the data. If the Auto Reset box is not visible, click on the Controls… button and then select Auto Reset from the drop down menu.
To view the electric field, switch to Field Analysis in the Data
View drop-down menu. From the Field drop-down menu, choose the
desired component of the electric field, E. The depField
field is the current density.
To obtain Fig. 489:
Select Field
E_xSelect Horizontal and Intercept of 0 for the lineout.
Select Perform Lineout and then select Dump: 80.
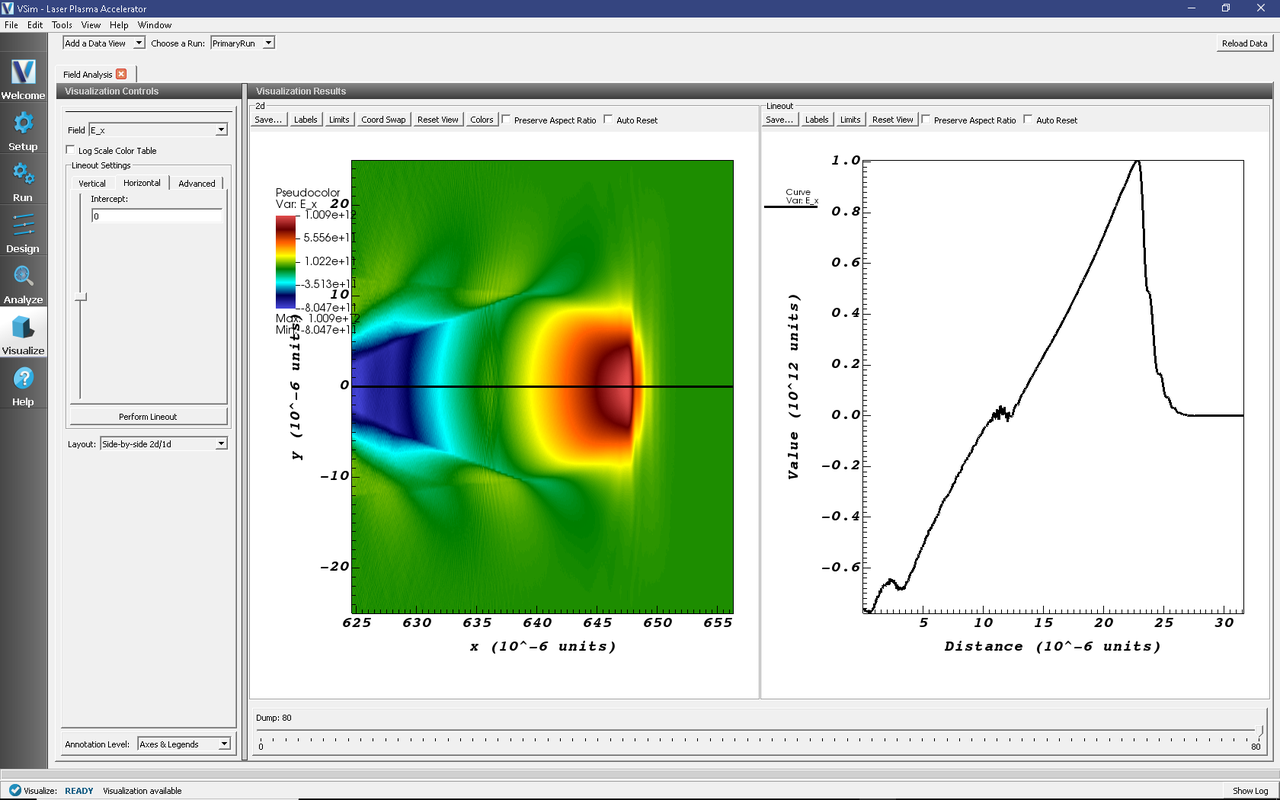
Fig. 489 The output of the run shows the accelerating field \(E_x\) after about 2 picoseconds.
The acceleration of the particles can be seen by viewing the (\(x\)) component of the velocity. To do this:
Switch to the Phase Space Data View in VSimComposer
Set the X-axis variable to
electrons0_x, and the Y-axis variable toelectrons0_ux.Set the color variable to
electrons0_uxThen click Draw.
You will see a color-coded picture of particle velocity like in Fig. 490.
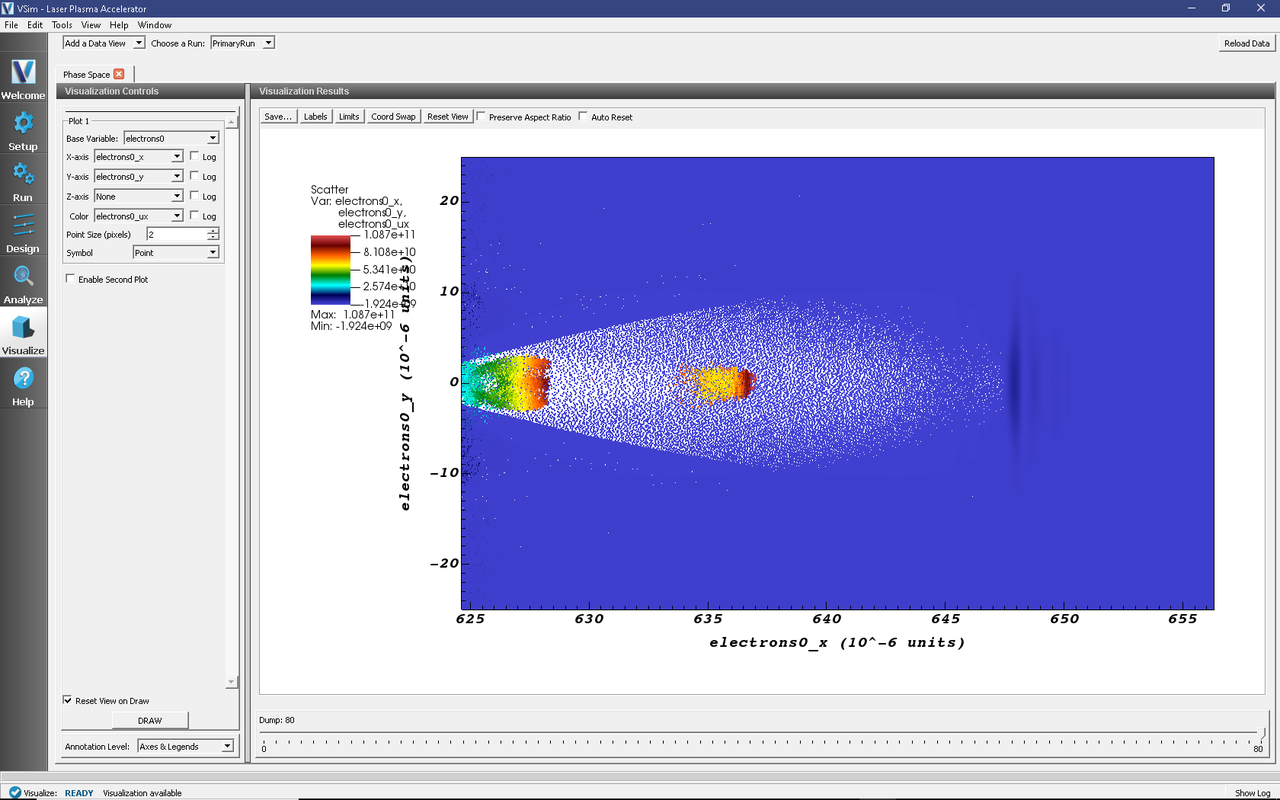
Fig. 490 Phase-space plot of plasma electrons at t = 2.1 picoseconds.
Further Experiments
Try increasing or decreasing the intensity of the laser pulse
through the parameter A_0 and see the effect on the shape of
the plasma wakefield.