Dielectric in Electromagnetics (dielectricInEM.sdf)
Keywords:
- dielectric, electromagnetics, capacitor
Problem Description
This simulation and the Dielectric in Electrostatics (dielectricInES.sdf) demonstrate the differences between simulating dielectric materials with electrostatic and electromagnetic solvers. They also demonstrate some of the more general differences between electrostatic and electromagnetic simulations.
Both of these simulations represent the same physical system: a slab of dielectric between two metal plates. The simulation grid is one square meter with a .75m x .25m slab of dielectric centered between the plates.
Unlike in the electrostatics simulation, in this simulation the full, coupled set of Maxwell’s equations are considered, so more nuanced and complete physics will be represented in this simulation. The trade-off is that the simulation will take longer to run, and a user has to have a deeper, more fundamental understanding of the physics relevant to the simulation.
For situations when the nuanced and detailed physics is important, an electromagnetic solver is often required. For other cases, the nuances and details are not important and an electrostatic approximation is an appropriate simplification of the system.
A rule of thumb to consider when deciding between electromagnetic and electrostatic solvers is how the wavelength of an EM wave, \(\lambda_{EM}\) compares to the length scale of the simulation domain, \(L_s\). If \(\lambda_{EM}\) is smaller than \(L_s\), an electromagnetic solver will be more appropriate. In other words, if many EM waves of interest fit inside the simulation grid, an electromagnetic solver will be necessary.
This criterion, \(\lambda_{EM} < L_s\), is equivalent to a criterion on the period of the EM oscillation \(T_{EM}\) and the time it takes light to cross the simulation domain, \(T_{\gamma}\). Divide both sides by the speed of light and we get \(T_{EM} < T_{\gamma}\). In this limit, information about changes to fields will not be able to travel across the simulation domain within one timestep, so we must pick a solver that respects relativity.
This simulation can be run with a VSimEM, VSimVE, or VSimPD license.
Opening the Simulation
The Dielectric in Electromagnetics example is accessed from within VSimComposer by the following actions:
Select the New → From Example… menu item in the File menu.
In the resulting Examples window expand the VSim for Electromagnetics option.
Expand the Electrostatics option.
Select Dielectric in Electromagnetics and press the Choose button.
In the resulting dialog box, create a New Folder if desired, then press the Save button to create a copy of this example.
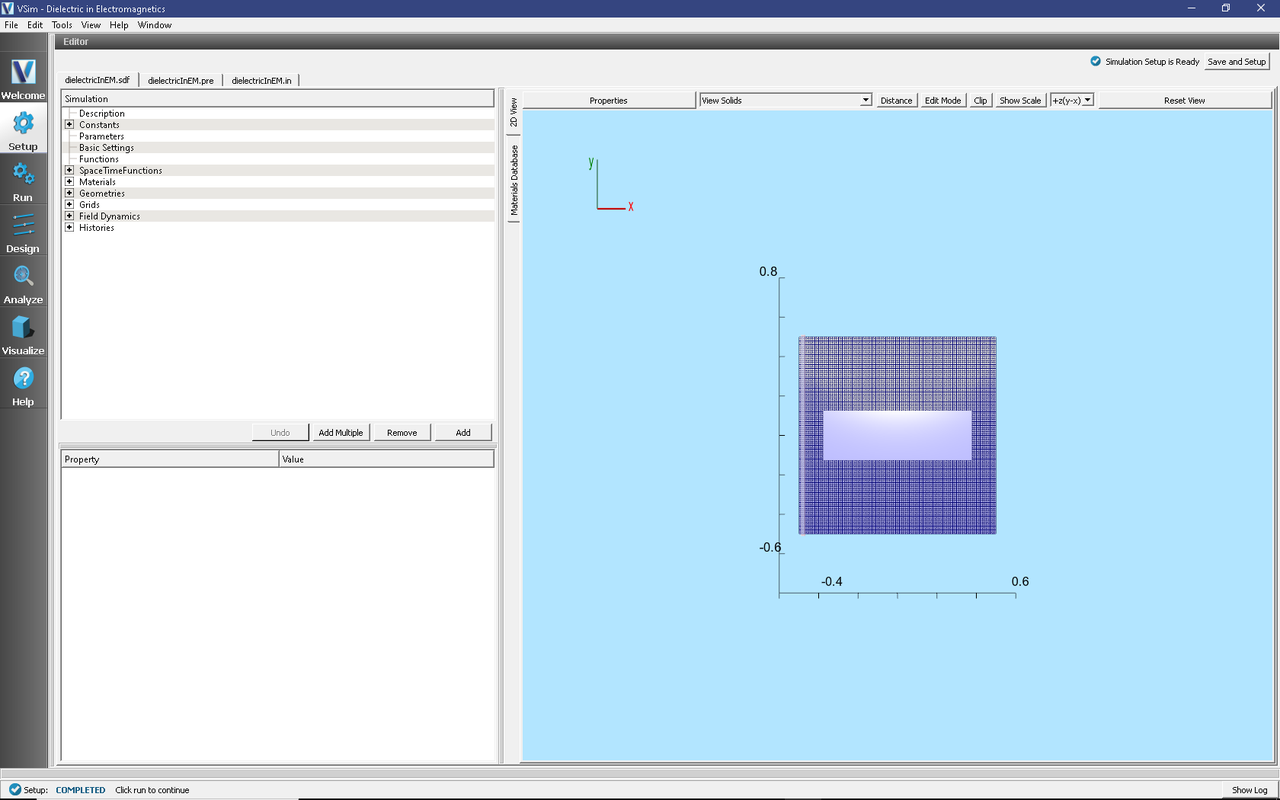
The resulting Setup Window is shown Fig. 244.

Fig. 244 Setup Window for the Dielectric in Electromagnetics example.
Simulation Properties
In full electromagnetics, the electric potential is a quantity that must be derived from line integrals of the electric field since it is not directly calculated (as is the case for electrostatics). This makes setting up potential differences between objects a little more complicated. So, to set a potential difference between the top and bottom plates in this simulation, a Distributed Current is set to run from the bottom of the simulation (lower y) to top (upper y).
The upper and lower y boundaries are set as a “PEC”, a perfect electrical conductor, under the Field Boundary Conditions element. The left and right walls (lower and upper x), are set as open boundaries, and so will let EM waves pass through unaffected.
The current effectively moves positive charge from the bottom boundary of the simulation to the top boundary making the top plate positively charged and the bottom plate negatively charged. This will result in an electric field that points down towards the lower y boundary, similar to the Dielectric in Electrostatics (dielectricInES.sdf) example.
The functional form of the current is a Gaussian, \(I(t) = e^{-(t-t_0)^2/(2*\sigma^2)}\). The constants \(t_0\) and \(\sigma\) are set with the constants DRIVE_PEAK_TIME and DRIVE_SPREAD, respectively. The default values for these constants were chosen somewhat arbitrarily, but so that the simulation results will resemble those from the electrostatic simulation.
The DRIVE_SPREAD (standard deviation of the current Gaussian), will set a time scale for the electromagnetic waves that will propagate through this simulation, so DRIVE_SPREAD was chosen to be much larger than the timestep so that the EM wavelength was much larger than the simulation domain.
Ideally, the PEAK_DRIVE_TIME would be much larger than the DRIVE_SPREAD because whenever a function is used to set a current, the current should be initialized so that \(I(0) = \frac{dI}{dt}|_{t=0} = 0\). That is, the current and its derivative are both zero when the simulation begins. This will reduce any “ringing” that may occur by an abrupt turn-on. The default value for PEAK_DRIVE_TIME for this simulation is 0, so at least the derivative of the current is zero. The Future Experiments section outlines how to do a higher fidelity simulation, and it will demonstrate the power of the electrostatic approximation. The Dielectric in Electrostatics (dielectricInES.sdf) simulation takes only one timestep to run.
To add the dielectric slab to the simulation, first a “Box” primitive shape was added
under Geometries → CSG. Then the Sapphire material was added to the
simulation and set as the material for the boxDielectic material.
Running the Simulation
To run the simulation:
Proceed to the run window by pressing the Run button in the left column of buttons.
Here you can set run parameters, including how many cores to run with (under the MPI tab).
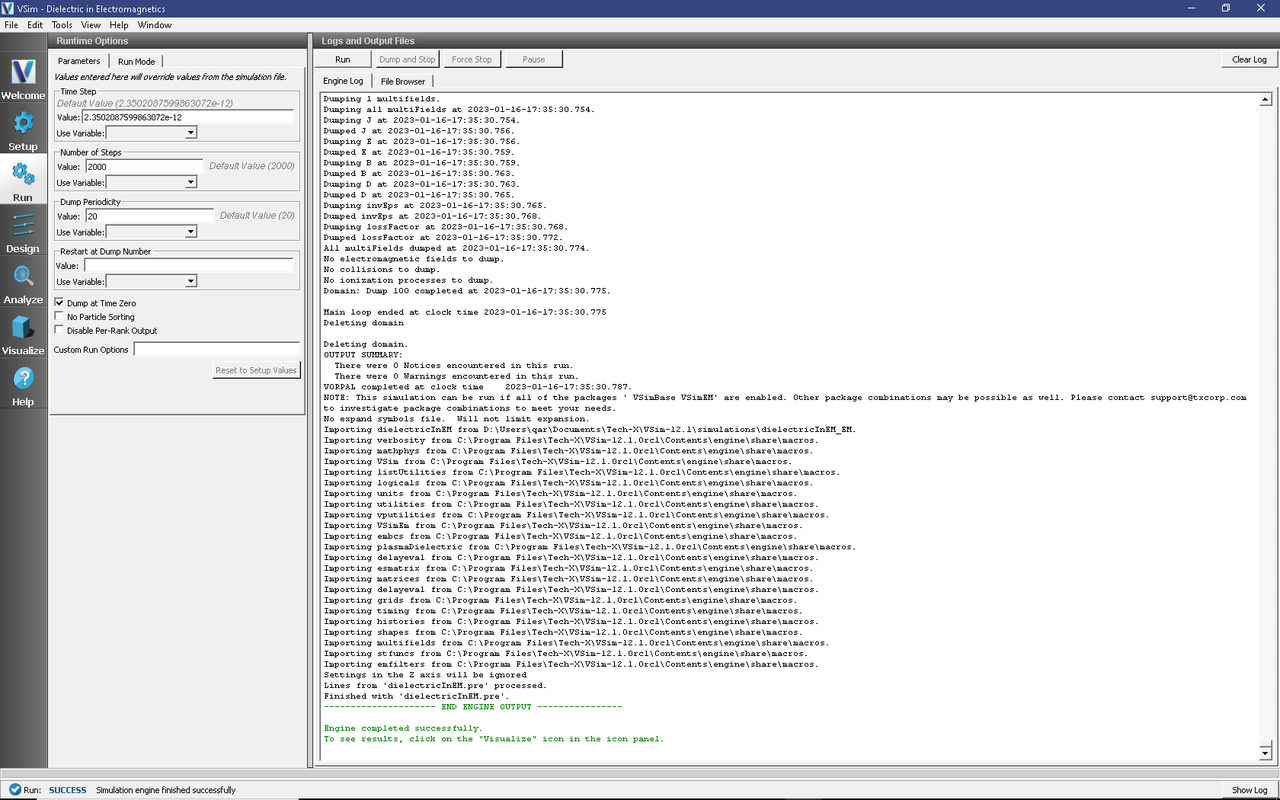
When you are finished setting run parameters, click on the Run button in the upper left corner. You will see the output of the run in the right pane. The run has completed when you see the output, “Engine completed successfully.” This is shown in Fig. 245.

Fig. 245 The Run window at the end of execution.
Visualizing the Results
After performing the above actions, the results can be visualized as follows:
Proceed to the Visualize Window by pressing the Visualize button in the navigation column.
With the Data Overview tab open, expand Scalar Data then expand E.
Check the box for E_y. This will plot the y-component of the electric field.
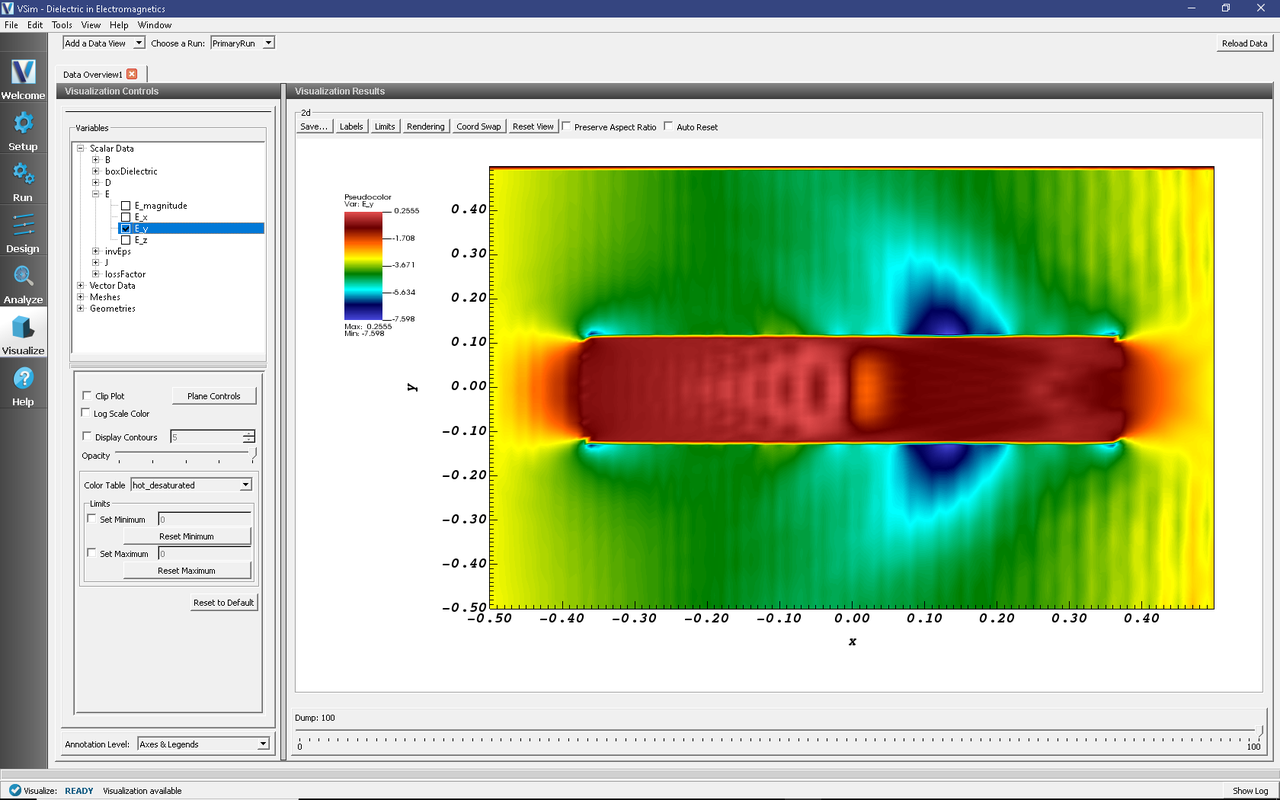
Scroll through the dumps to see how the y-component of the electric field changes with time. The last dump is shown in Fig. 246.

Fig. 246 The y-component of the Electric Field.
As you scroll through the dumps, you will notice that a wave front propagates through the simulation from left to right. We see this wave front because electromagnetics respects relativity. Any electromagnetic signal can travel no faster than the speed of light. When the simulation begins, there is no voltage difference between the upper and lower plates. At \(t=0\), the current turns on and then a signal begins traveling (at the speed of light) from the left to the right that a voltage difference has been established.
Additionally, you can see reflections of this wave off the vacuum-dielectric interface, and refracted waves entering dielectric. There is also some “ringing” which appears as ripples in the electric field from the abrupt current turn on.
Further Experiments
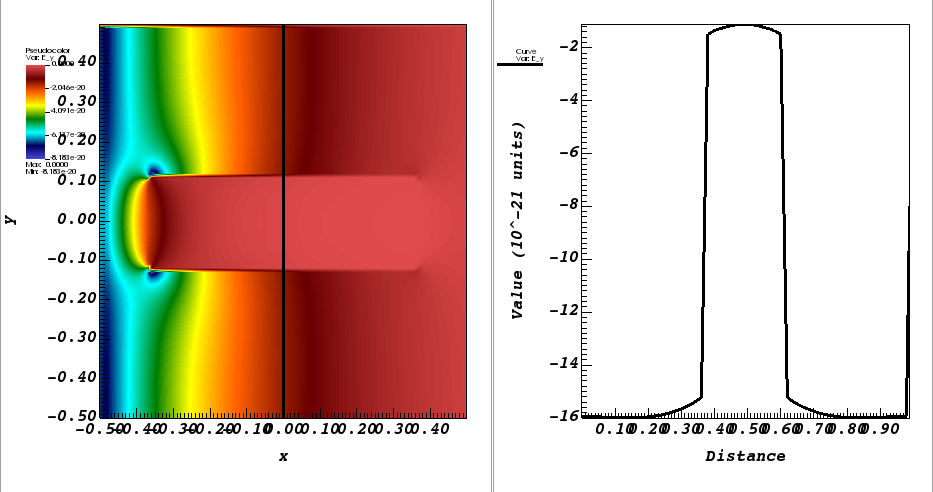
1. Experiment with different values of the DRIVE_PEAK_TIME and DRIVE_SPREAD constants that tune the Gaussian current. Try a value of \(10^{-7}\) for the DRIVE_PEAK_TIME while leaving the DRIVE_SPREAD at its default value of \(10^{-8}\). This will shift peak of the Gaussian far beyond the end of the simulation, so that the smooth, flat, far left tail of the Gaussian, with values close to zero, sets the current. What do you notice about the noisiness of the y-component of the Electric Field? How much longer would you have to run before the current ramps up to its maximum value then drops back down to zero to produce the image below?

Fig. 247 The y-component of the electric field after the current ramped up and then back down to zero.
2. Then put the DRIVE_PEAK_TIME back to the original, default value of \(10^-10\) and change the DRIVE_SPREAD to a much smaller value, like \(10^-10\). Given the discussion about timescales in the Problem Description and Simulation Properties sections what changes would you expect to see?
3. Normalize the current Gaussian so that you can control the final value of the y-component of the electric field.