HDF5 Format Data Output Files
Vorpal outputs data in two forms, text and HDF5. Text output is used
for progress reporting, while HDF5 is used for data files. The HDF5
data files have the .h5 suffix.
Hierarchical Data Format Version 5 (HDF5) is a library and file format for storing graphical and numerical data and for transferring that data between computers. Vorpal and VSimComposer output data in HDF5 format. The Hierarchical Data Format was developed by the National Center for Supercomputing Applications at the University of Illinois at Urbana-Champaign. For more information about HDF5 (See http://hdfgroup.org/HDF5).
Frequency for dumping simulation quantities
The following are the general dumping options that can be set in field, particle, and grid boundary blocks. These can be used when the user wishes to customize the dumping options for the particular blocks and not change the global dumping options.
dumpOncePerRun (boolean)If true, this object will be dumped only once per run. This specification can co-exist with other specifications.
commandLineDumpPeriodicity (integer)This option may be automatically set by vorpal to override other attributes specifying when this object should dump its data.
dumpPeriodicity (integer)If dumpPeriodicity = p, then this object will be dumped to disc when its timestep mod p equals 0.
If p=0, this object ” “will never be dumped.
dumpPeriod (integer)(deprecated: please use dumpPeriodicity instead)
If dumpPeriodicity = p, then this object will be dumped to disc when its timestep mod p equals 0.
If p=0, this object will never be dumped.
dumpSteps (integer list)A list of the time steps at which this object should dump its data to disc.
dumpSteps (expression)A function of a scalar integer n (the current time step) that returns 1 if this object should be dumped at step n, and 0 if not.
To use an Expression, it must be specified within the <Expression dumpSteps> block:
expression = (a function of 'n', the timestep, that yields 0 or 1)
For example, expression = ( mod(n, 100) == 0 )
or           expression = ( or(n==100, n==200))
Vorpal produces one HDF5 file for each field or species at each
dump time. For example, if the simulation parameter
nsteps = 100 and the simulation parameter
dumpPeriodicity = 10,
Vorpal dumps data 10 times during the simulation and outputs a total of
10 HDF5 files for each field or species while running the simulation.
Vorpal also produces one Globals file at each dump containing
data that is general to the whole simulation, as opposed to one species
or field. Finally, Vorpal puts out a History file containing
the data of the specified histories.
Change the Names of Output Files
If you want to change the names of the output files, which include the .h5 files, you can specify the -o output option when you run Vorpal.
For example, you want to replace emPlaneWave with
emPlaneWaveTest1 in the names of the emPlaneWave
simulation’s output files. Run Vorpal from the command line using this
command:
vorpal -i emPlaneWave.in -o emPlaneWaveTest1
Then the text output files would be:
emPlaneWaveTest1_all_1.txtemPlaneWaveTest1_comms_0.txtemPlaneWaveTest1_completed.txtemPlaneWaveTest1_dumpedobjs_0.txt
and a field output files might be:
emPlaneWaveTest1_edgeE_1.h5
Displaying the Content of .h5 Files
The h5dump utility converts the binary data in
.h5 files into human-readable ASCII data in .txt
files, and is available for all the platforms on which Vorpal
runs. You can download the utility from the HDF5 website
(http://hdfgroup.org/HDF5).
The basic command is:
h5dump -o output_file_name.txt your_h5_file.h5
So, to convert the emPlaneWave_edgeE_1.h5 to text format,
use this command:
h5dump -o emPlaneWave_edgeE_1.txt emPlaneWave_edgeE_1.h5
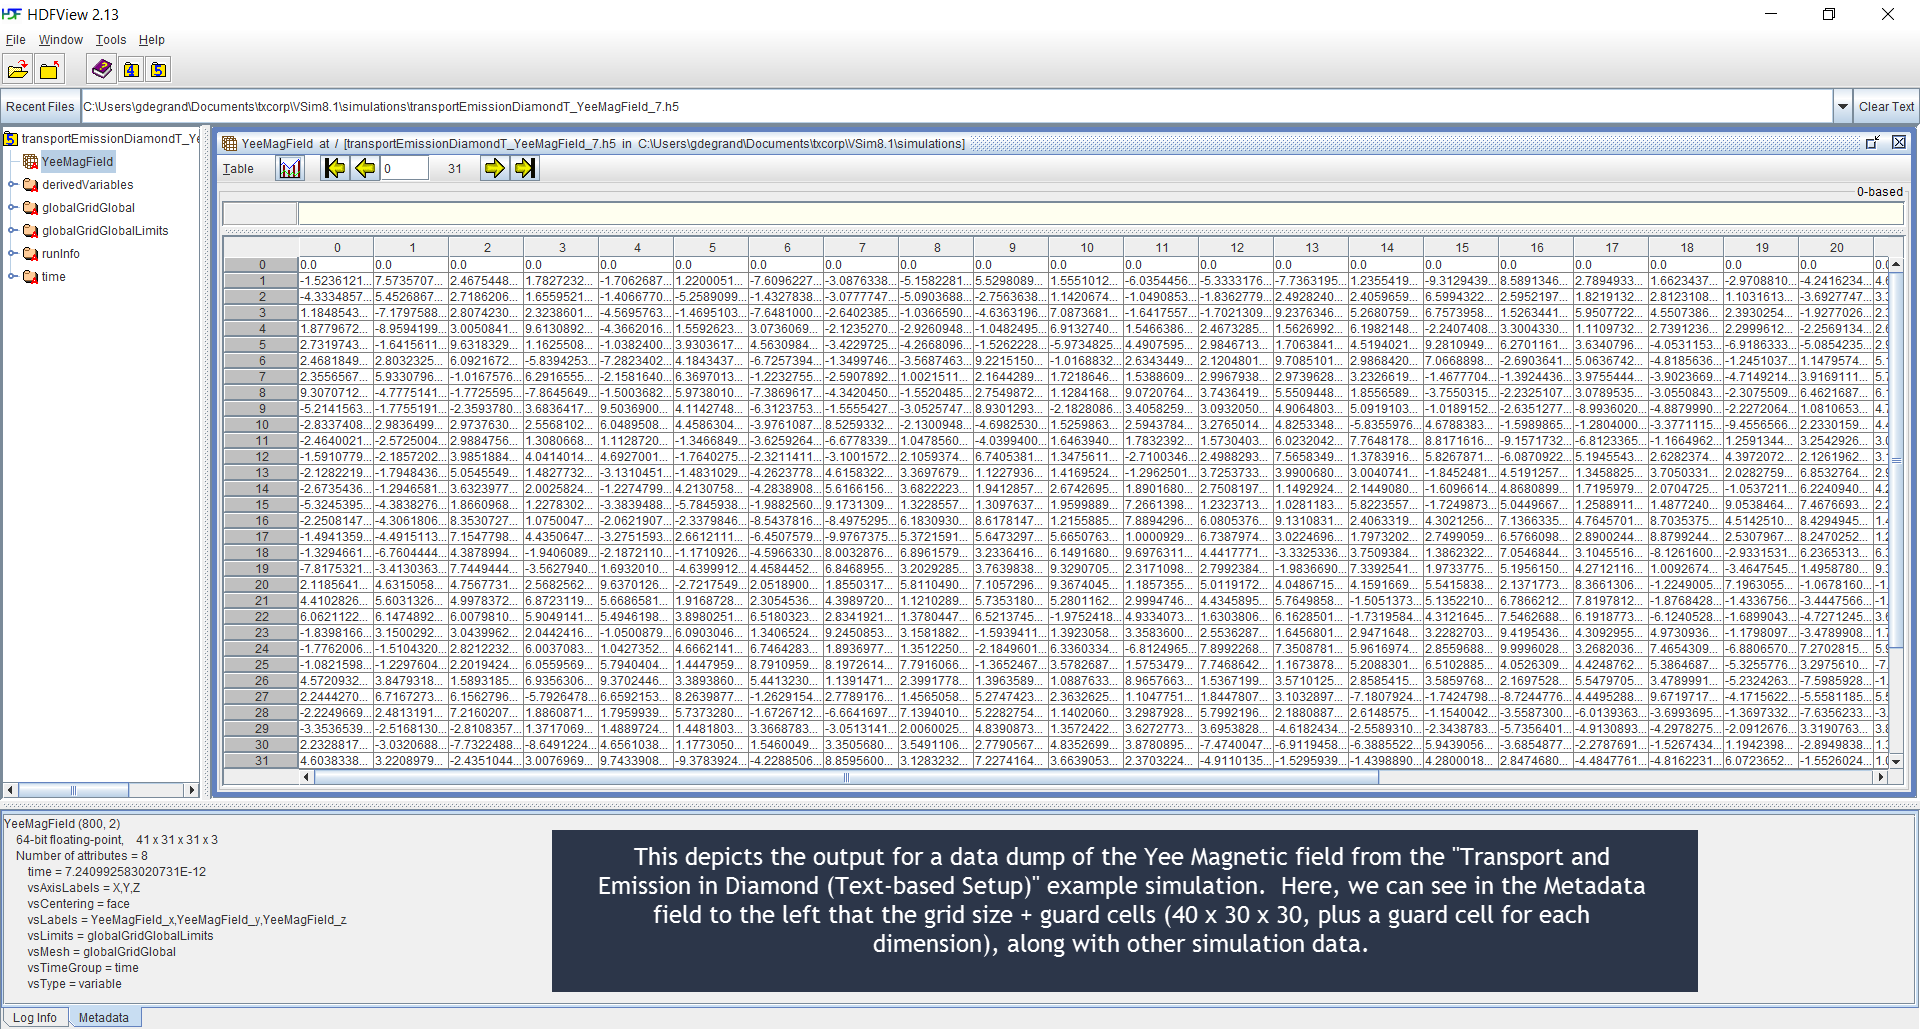
The HDFView is a GUI code for displaying the contents of hdf5 files. Example output is shown below. HDFView may be downloaded for free from the HDF Group (http://www.hdfgroup.org/hdf-java-html/hdfview/)
Structure of Simulation Output .h5 Files
For each type of output file below, main data entries within that output file are displayed as a list of fields at the same level within the list. For those data fields within an output file that contain one or more subcategories of data, subcategories appear in an indented list below the main data category to which the subcategories apply.
Globals file
compGridGlobal
runInfo
time
GridBoundary file
name
    int array [NX NY NZ 2]
    name[0] = true (1) or false (0) is the lower left front corner inside or not?
    name[1] = true (1) or false (0) is the cell center inside or not?
nameLargeBndryFaces
nameLargeFaceFracs
nameSmallBndryFaces
nameSmallFaceFracs
nameStairStepBndryEdgesData
nameStairStepBndryFacesData
compGridGlobal
compGridGlobalLimits
derivedVariables
poly
runInfo
time
SumRhoJ file
SumRhoJ
    int array [NX NY NZ 4]
    SumRhoJ[0] = Rho, charge density
    SumRhoJ[1] = Jx
    SumRhoJ[2] = Jy
    SumRhoJ[3] = Jz
compGridGlobal
compGridGlobalLimits
runInfo
time
emMultiField field (MagMultiField) file
MagMultiField
    int array [NX NY NZ 3]
    MagMultiField[0] = Bx
    MagMultiField[1] = By
    MagMultiField[2] = Bz
compGridGlobal
compGridGlobalLimits
derivedVariables
runInfo
time
Below is an hdf5view of a field file.

Fig. 80 HDFView display of a field file.
History file
runInfo
historyName1
historyName2
Note
These historyName arrays contain time data pertaining to the type of history chosen in the input file.
Fluid file
NeutralGasName
    int array [NX NY NZ 1]
    NeutralGasName[0] = Density
compGridGlobal
compGridGlobalLimits
runInfo
time
Species (particle) file
species
  int array [NX NY NZ 6]
  species[0] = x position
  species[1] = y position
  species[2] = z position
  species[3] = x velocity
  species[4] = y velocity
  species[5] = z velocity
compGridGlobalLimits
runInfo
time
Note
The information above is representative of 3D data. The actual number of elements in an array may vary depending on the dimensionality of the simulation. The number of elements in a species output file will also vary based on the type of species used. For more information on the output of species data, see the next section.
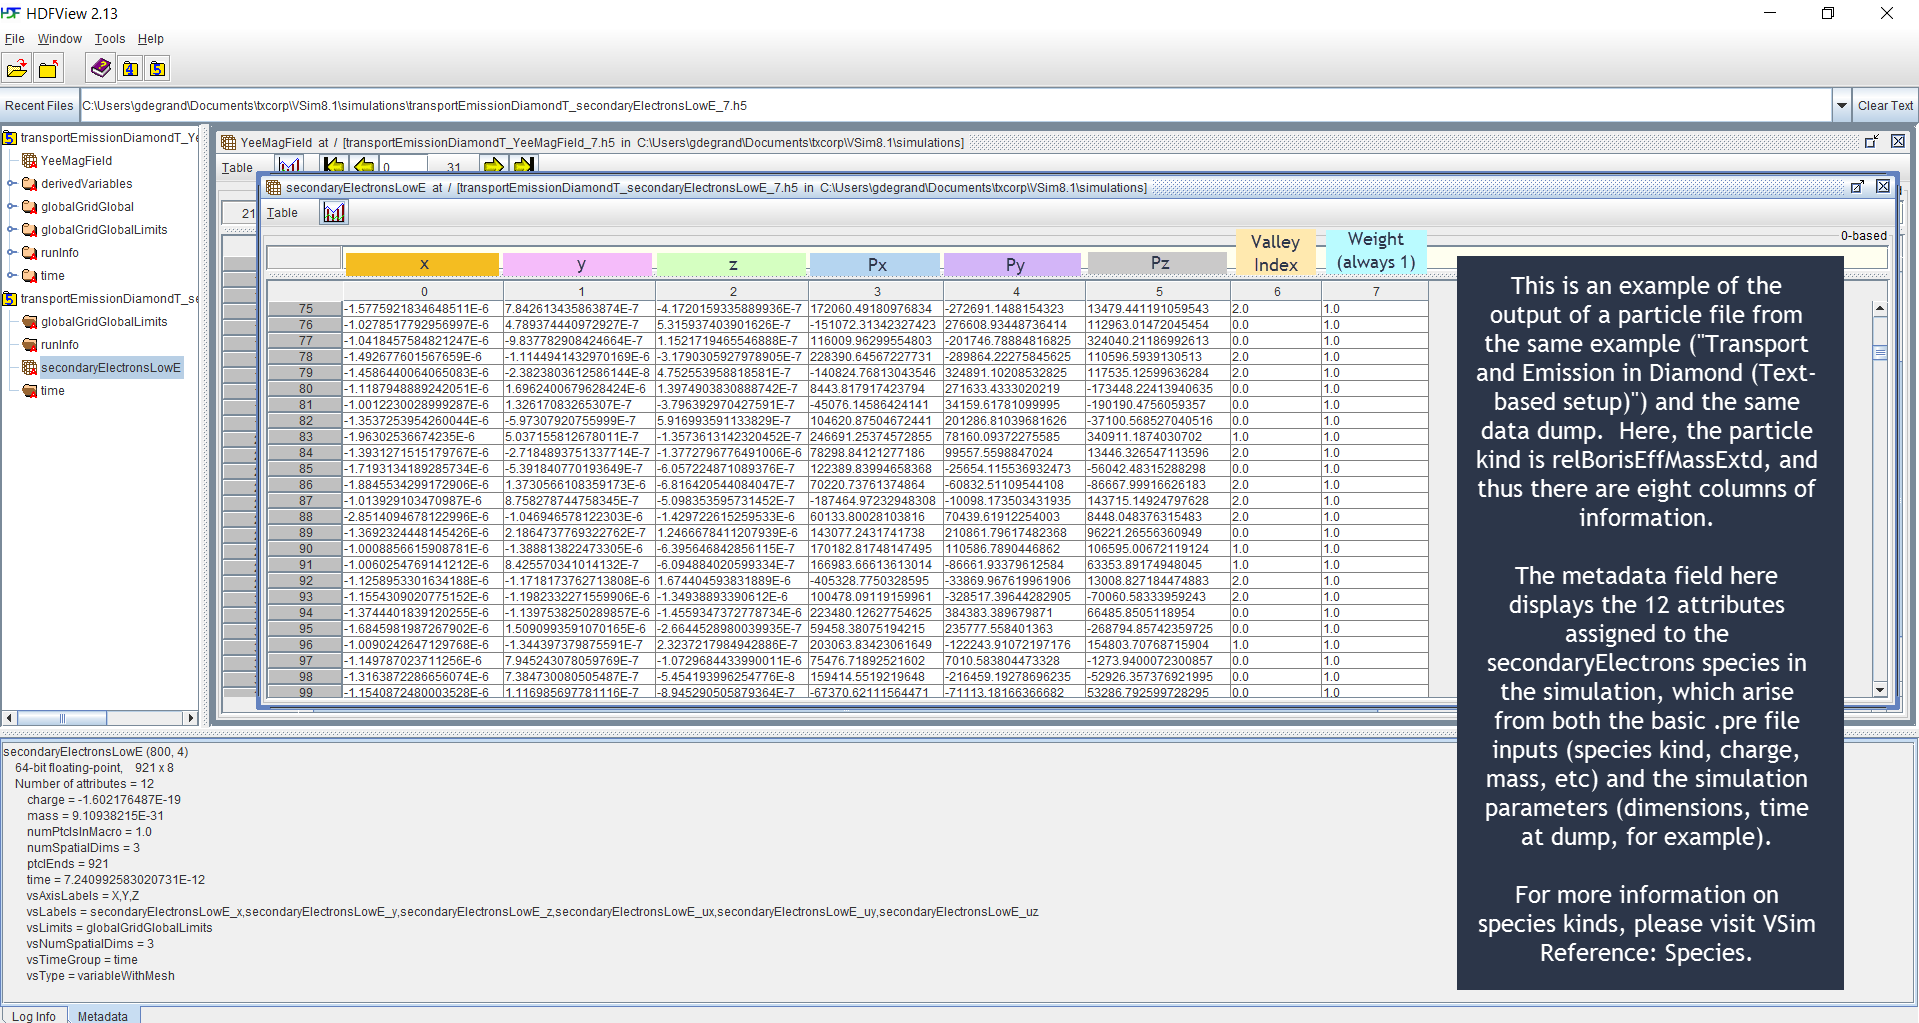
Below is an hdfview display of a species (particle) file

Fig. 81 HDFView display of particle file.
Columns in Species (Particle) .h5 Output Files
Below is a table displaying how the columns in particle simulation .h5
output files for various species kinds correspond to the columns that
can be seen in the .h5 file when the file is opened using a tool such as
HDFView. HDFView may be downloaded for free from the HDF Group at
http://www.hdfgroup.org/hdf-java-html/hdfview/. HDFView distributions
are available for 32-bit and 64-bit Linux, Mac, and Windows platforms.
Species |
Number of Columns |
Comma-separated Columns |
|---|---|---|
cmplxRelBorisDF |
5 + NDIM |
x,[y,[z]]Px, Py, Pz, real weight, imaginary weight |
envBoris |
5 + NDIM |
x,[y,[z]]Px, Py, Pz, tag, weight |
freeRel |
3 + NDIM |
x,[y,[z]]Px, Py, Pz |
freeRelVW |
4 + NDIM |
x,[y,[z]]Px, Py, Pz, weight |
noMove |
3 + NDIM |
x,[y,[z]]Px, Py, Pz |
noMoveVW |
4 + NDIM |
x,[y,[z]]Px, Py, Pz, weight |
nonRelBoris |
3 + NDIM |
x,[y,[z]]Px, Py, Pz |
nonRelEs |
3 + NDIM |
x,[y,[z]]Px, Py, Pz |
relBoris |
3 + NDIM |
x,[y,[z]]Px, Py, Pz |
relBorisBallisticVW |
4 + NDIM |
x,[y,[z]]Px, Py, Pz, weight |
relBorisCyl |
3 + NDIM |
u0,[u1,[u2,]]P0, P1, P2 (see Legend) |
relBorisDF |
4 + NDIM |
x,[y,[z]]Px, Py, Pz, weight |
relBorisEffMassExtd |
2 + 3(NDIM always 3) |
x, y, z, Px, Py, Pz, valley index, weight (always 1) |
relBorisFuncVW |
4 + NDIM |
x,[y,[z]]Px, Py, Pz, weight |
relBorisTagged |
4 + NDIM |
x,[y,[z]]Px, Py, Pz, tag |
relBorisVW |
4 + NDIM |
x,[y,[z]]Px, Py, Pz, weight |
relBorisVWTagged |
5 + NDIM |
x,[y,[z]]Px, Py, Pz, tag, weight |
relBorisVWScale |
6 + NDIM |
x,[y,[z]]Px, Py, Pz, tag, scale parameter, weight |
NDIM |
Number of Dimensions: 1, 2, or 3 |
|
|---|---|---|
Dimension Notation |
||
1D |
2D |
3D |
x |
x y |
x y z |
1D |
1D,[2D] |
1D,[2D,[3D]] |
Cylindrical Coordinates |
||
Polar |
u0, u1, u2 |
r, phi, z |
Cylindrical |
u0, u1, u2 |
z, r, phi |
Tubular |
u0, u1, u2 |
phi, z, r |
Momentum/Mass Notation Convention |
||
momentum/mass = gamma*v = P |
||
gamma*vx:Px |
gamma*vy: Py |
gamma*vz: Pz |