Half-Wave Antenna (halfWaveAntenna.sdf)
Keywords:
- electromagnetics, antennas
Problem Description
The half wave antenna example describes a simple box source in a vacuum.
This simulation can be performed with any license.
Opening the Simulation
The Half Wave Antenna example is accessed from within VSimComposer by the following actions:
Select the New → From Example… menu item in the File menu.
In the resulting Examples window expand the VSim for Basic Physics option.
Expand the Basic Examples option.
Select Half Wave Antenna and press the Choose button.
In the resulting dialog, create a New Folder if desired, and press the Save button to create a copy of this example.
All of the properties and values that create the simulation are now available
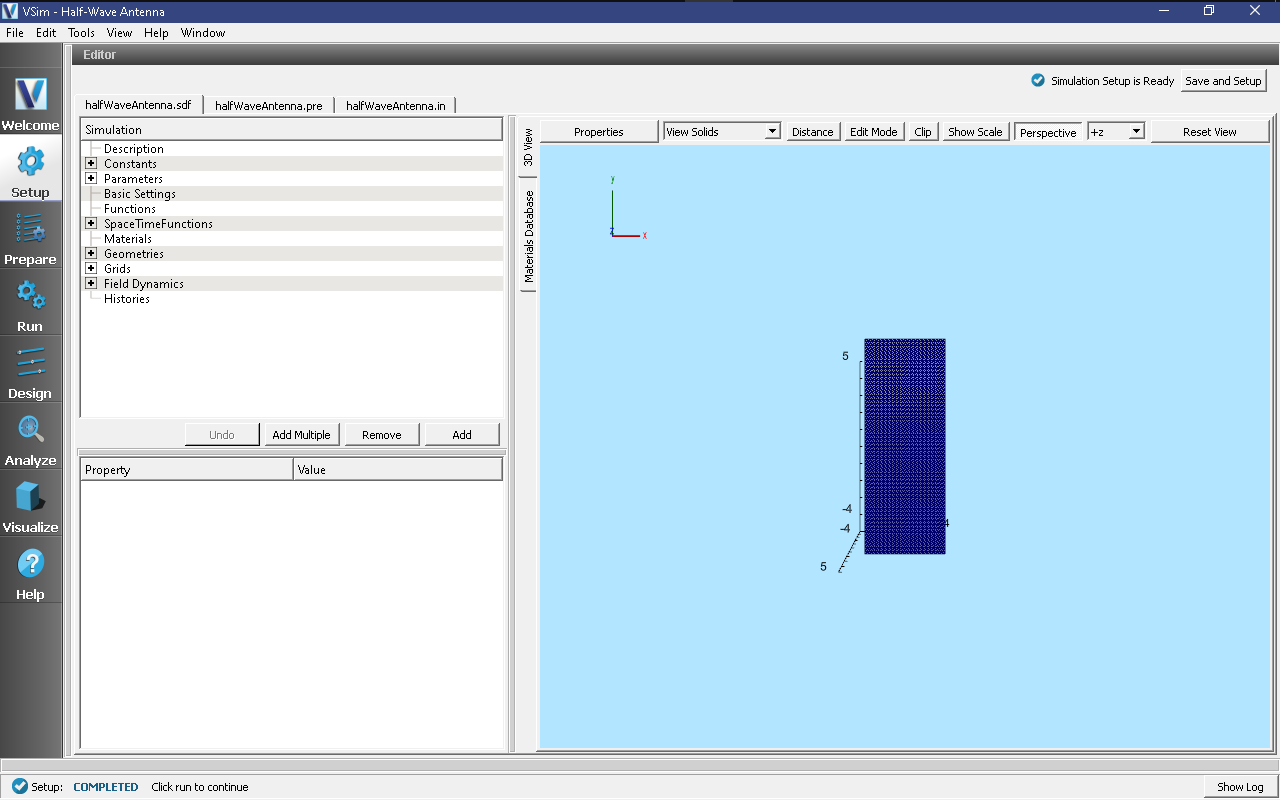
in the Setup Window as shown in Fig. 160.
You can expand the tree elements and navigate through the
various properties, making any changes you desire. The right pane shows a 3D
view of the geometry, if any, as well as the grid, if actively shown. To show
or hide the grid, expand the Grid element and select or deselect the box next
to Grid.

Fig. 160 Setup Window for the Half Wave Antenna example.
Simulation Properties
This example includes several constants for easy adjustment of simulation properties, Including:
WAVELENGTH: The wavelength of the antenna
There is also a SpaceTimeFunction to define the current driver of the half wavelength source.
Other properties of the simulation include port boundaries on all sides except for the lower x boundary, which is a perfect electric conductor. A Distributed Current source is used to set the current of the half wavelength source.
Running the Simulation
After performing the above actions, continue as follows:
Proceed to the Run Window by pressing the Run button in the left column of buttons.
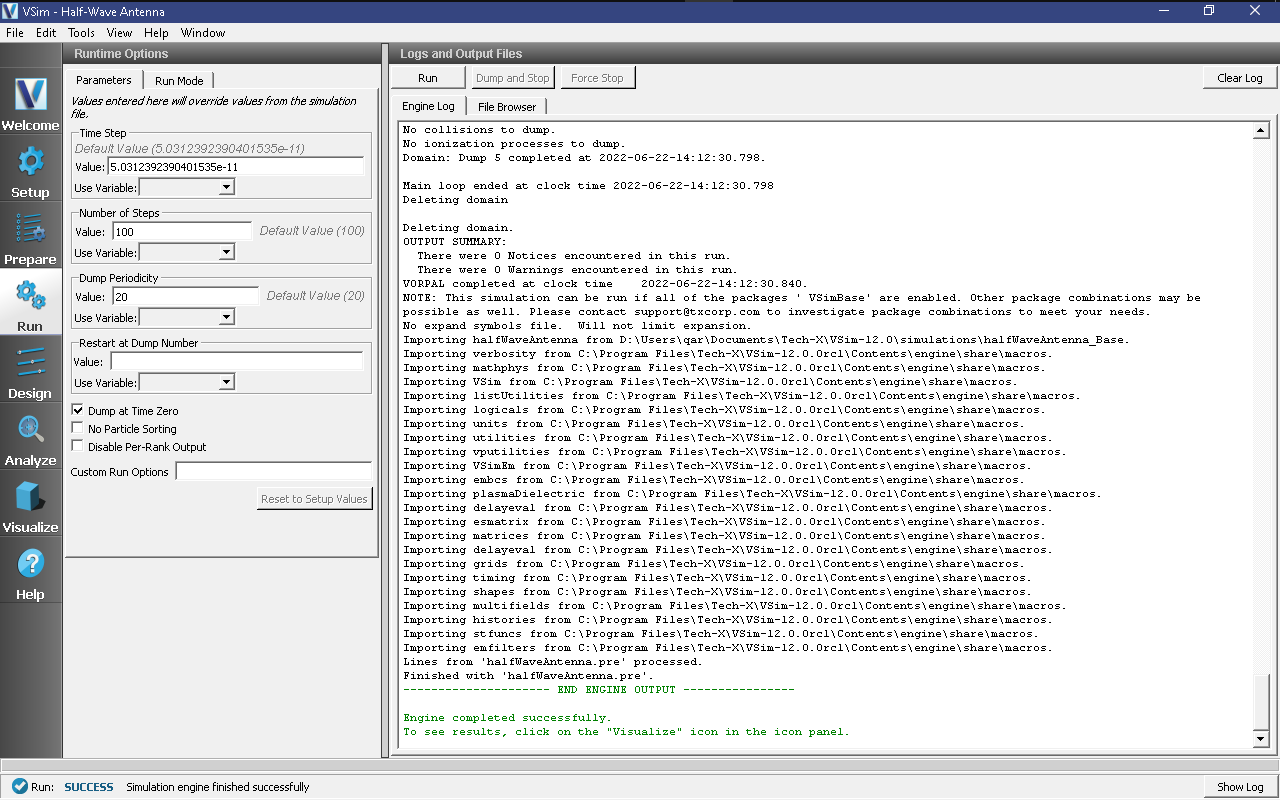
To run the file, click on the Run button in the upper left corner of the Logs and Output Files pane. You will see the output of the run in the right pane. The run has completed when you see the output, “Engine completed successfully.” This is shown in Fig. 161.

Fig. 161 The Run Window at the end of execution.
Visualizing the Results
After performing the above actions, continue as follows:
Proceed to the Visualize Window by pressing the Visualize button in the left column of buttons.
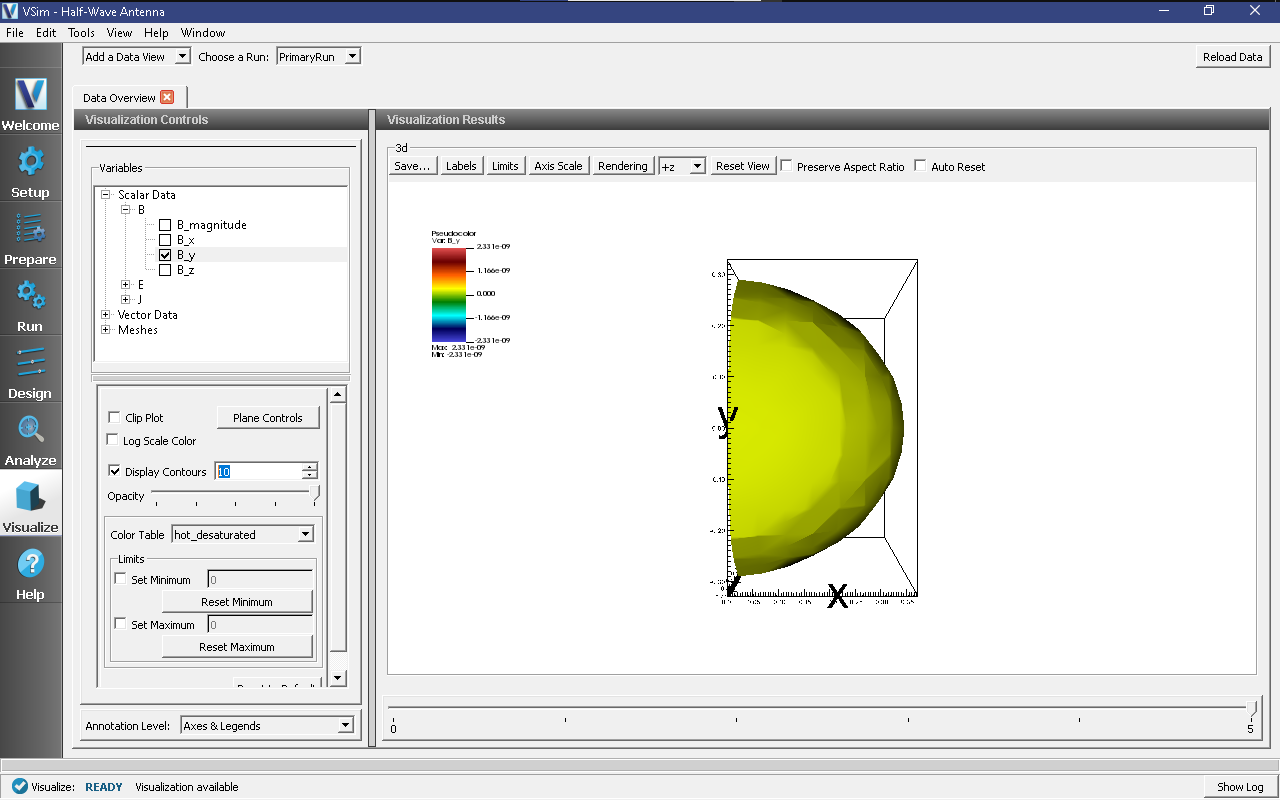
To view the field pattern as shown in Fig. 162, do the following:
Expand Scalar Data
Expand B
Select B_y
Select Display Contours and set the # of Contours to 10
Move the dump slider forward in time to the last dump
Rotate the plot by clicking and dragging with your mouse

Fig. 162 Visualization of the wave pattern as a color contour plot.
Further Experiments
Additional experiments worth investigating are:
Change the frequency of the source.